Highlights
- AI agent observability captures the complete execution path of an agent using traces and spans.
- 89% of organizations have some form of agent observability, but only 62% have detailed tracing into individual steps and tool calls.
- OpenTelemetry provides standard conventions for tracing model calls, agent invocations, tool executions, token usage, and other GenAI operations.
- AI agents can be instrumented through auto-instrumentation, decorators, or manual tracing.
- Netra captures agent traces across model calls, tool executions, retrievals, token usage, latency, and cost using OpenTelemetry-based instrumentation.
A support agent returns the wrong answer and takes four seconds longer than usual.
The application itself is healthy. No request crashed. The model returned a response. But the available log only shows that the overall request took longer than expected.
It does not reveal whether the delay came from the model, retrieval, a tool call, a retry, or a handoff between agents.
The team knows something went wrong, but not where.
That is the gap AI agent observability and AI agent monitoring are designed to close.
Traditional logs show that an event happened. Agent observability reconstructs the execution path behind that event so teams can understand what the agent actually did.
What AI Agent Observability Means
A trace represents the complete journey of a request through an AI application.
For an AI agent, that journey may include:
- model calls
- prompts and completions
- retrieval operations
- database queries
- tool calls
- API requests
- agent decisions
- handoffs
- retries and failures
Each individual operation inside a trace is represented by a span.
An LLM call can be a span. A tool invocation can be another. A retrieval step can be another. Higher-level workflows can contain several child spans underneath them.
These parent-child relationships preserve the sequence of execution.
For example, a support agent may receive a request, retrieve account information, call an LLM, check an order through a tool, call the model again, and produce a response.
Looking only at total request latency compresses all of that behaviour into one number.
A structured trace preserves the execution path.
That is the foundation of observability tracing for AI agents.
From Basic Logging to Full AI Agent Tracing
Agent observability can be viewed through three practical levels of visibility.
These levels are not an industry standard. They simply illustrate the difference between basic logging and detailed span-level tracing.
Level 1: Basic logging
Basic application logs typically show whether a request succeeded, its overall latency, timestamps, and errors.
That is enough to detect obvious failures.
It is much less useful when an agent technically succeeds but calls the wrong tool, repeats an operation, retrieves irrelevant context, or produces a poor final answer.
Level 2: Request-level visibility
Request-level monitoring adds more context around individual runs.
Teams can identify requests, inspect overall timing, and associate metadata with each execution.
But the internal agent behaviour may still remain hidden.
A request that took eight seconds could contain several model calls, retrievals, tools, and retries. Without granular spans, the team can identify the slow request but not the operation responsible.
LangChain's 2026 State of Agent Engineering report found that 89% of organizations have some form of agent observability, while only 62% have detailed tracing into individual steps and tool calls.
Level 3: Full span-level tracing
Full tracing represents the agent execution as a hierarchy of spans.
Individual operations can contain metadata such as:
- model name
- input and output tokens
- duration
- cost
- tool name
- tool inputs and outputs
- status
- custom attributes
- prompt and completion content when enabled
This makes it possible to move from identifying a bad request to identifying the specific operation that contributed to it.
Among teams already running agents in production, the same LangChain study found that 94% have some form of observability and 71.5% report full tracing capabilities.
As agents move into production, this step-level visibility becomes increasingly important because the final response rarely explains how the system arrived there.
What an AI Agent Trace Should Capture
Good AI agent observability starts with capturing the right operations.
A dashboard cannot reconstruct information that was never instrumented.
LLM calls
Model spans should capture enough information to understand each generation, including the model, token usage, latency, status, and, where appropriate, prompt and completion content.
This supports debugging, LLM monitoring, LLM observability, cost analysis, and model comparisons.
Tool calls
Agents often act through tools rather than generating text alone.
Tool spans help show which tool was selected, what inputs it received, what it returned, how long it took, and whether it succeeded.
This helps separate a model reasoning problem from a tool or integration problem.
Retrieval operations
RAG-based agents depend on the context they retrieve.
Tracing retrieval helps distinguish a generation failure from a context failure. The model may respond reasonably given the information it received while the retrieval system supplied incomplete or irrelevant context.
Agent and workflow operations
Higher-level spans preserve the structure around model calls, tools, tasks, and handoffs.
That hierarchy makes the trace readable as an execution flow rather than a flat list of events.
OpenTelemetry for AI Agent Observability
Netra's tracing is built on OpenTelemetry, which provides common conventions for collecting and representing telemetry.
For teams implementing LLM tracing or AI agent observability, OpenTelemetry provides a standard foundation for representing model, agent, tool, and retrieval operations.
OpenTelemetry's GenAI semantic conventions define operations such as:
- chat
- invoke_agent
- invoke_workflow
- execute_tool
- retrieval
- embeddings
They also define attributes for model information and token usage.
Prompt messages, completions, tool arguments, and tool results can be captured when content recording is enabled. Because this information can be sensitive, content capture should be configured according to application privacy and security requirements.
The practical benefit of OpenTelemetry is standardization.
Applications can emit structured telemetry without creating a proprietary definition for every model call, tool execution, or agent operation.
This also makes OpenTelemetry tracing useful for teams that want observability data to remain portable across compatible systems.
Three Ways to Instrument an AI Agent
Netra supports three complementary approaches to tracing.
1. Auto-instrumentation
Auto-instrumentation is the fastest option for supported libraries, providers, databases, and frameworks.
Once the Netra SDK is initialized, supported operations can be captured automatically without manually creating spans around every call.
2. Decorators
Decorators add explicit structure where an application needs more control.
Netra provides four primary decorators:
- @workflow for a high-level workflow
- @agent for an AI agent or orchestrator
- @task for an individual unit of work
- @span for a custom operation
They are useful for adding business-level structure that may not be visible through automatic instrumentation alone.
3. Manual tracing
Manual tracing provides the greatest control over span boundaries, metadata, attributes, and status.
A production application can combine all three approaches: auto-instrumentation for supported libraries, decorators for business context, and manual spans for custom operations.
AI Agent Observability Best Practices
Good instrumentation should make production behaviour easier to understand, not simply generate more telemetry.
Trace the complete workflow
An AI agent is more than its LLM calls.
Tools, retrievals, APIs, agent handoffs, and application logic can all contribute to a failure.
Tracing only the model creates an incomplete view of the system. The trace should capture enough of the workflow to explain how the final response was produced.
Preserve the span hierarchy
Parent-child relationships make complex traces easier to understand.
A structured hierarchy separates the overall request from individual operations and shows how those operations relate to one another.
Capture latency, tokens, and cost at the span level
Overall request metrics can hide one expensive or slow operation.
Span-level metrics make it easier to identify which model call, tool, or retrieval caused an increase in latency, tokens, or cost.
These signals also act as useful agent performance metrics when teams are monitoring production efficiency.
Add application context
Useful context may include the environment, agent name, tenant, workflow, release, model, or other business attributes.
This makes it possible to move beyond debugging one trace and identify patterns across many similar executions.
Be deliberate about content capture
Prompts, responses, retrieved context, and tool arguments can be useful for debugging but may contain sensitive information.
Content capture should therefore be configurable and aligned with privacy requirements.
Use filters and saved views
As trace volume grows, manually reviewing individual requests becomes impractical.
Filters and saved views help teams repeatedly isolate failures, high-latency traces, specific tenants, tools, agents, or unusual cost patterns.
This is where an AI observability platform becomes more useful than raw logs alone: the goal is not simply to collect telemetry, but to make relevant traces easier to investigate.
How Does Netra Handle AI Agent Observability?
Netra uses OpenTelemetry-based tracing to capture the execution flow of AI applications and agents.
A trace represents the complete request, while nested spans represent model calls, retrievals, tools, database operations, agent steps, and other operations inside that request.
The workflow starts with instrumentation and continues into investigation.
1. Instrument the application
Netra provides SDKs for Python and TypeScript and supports auto-instrumentation for supported LLM providers, vector databases, and AI frameworks.
Configuration in the can include the application name and environment:
Netra.init(app_name="my-ai-app", environment="production")
for python and
await Netra.init({
appName: "my-ai-app",
headers: `x-api-key=${process.env.NETRA_API_KEY}`,
environment: "production",
});
for typescript.
Authentication and telemetry endpoints can also be configured through environment variables such as NETRA_API_KEY and NETRA_OTLP_ENDPOINT.
If an application already uses OpenTelemetry, existing OTLP telemetry can also be exported to Netra without rebuilding the tracing model around a proprietary format.
2. Capture supported AI operations automatically
Once Netra is initialized, supported instrumentations can capture model and framework operations automatically.
Depending on the integration, this can include:
- prompts and completions
- LLM calls
- model information
- tool executions
- retrieval operations
- token usage
- latency
- cost
- agent and framework operations
For application-specific steps, teams can add @workflow, @agent, @task, or @span decorators.
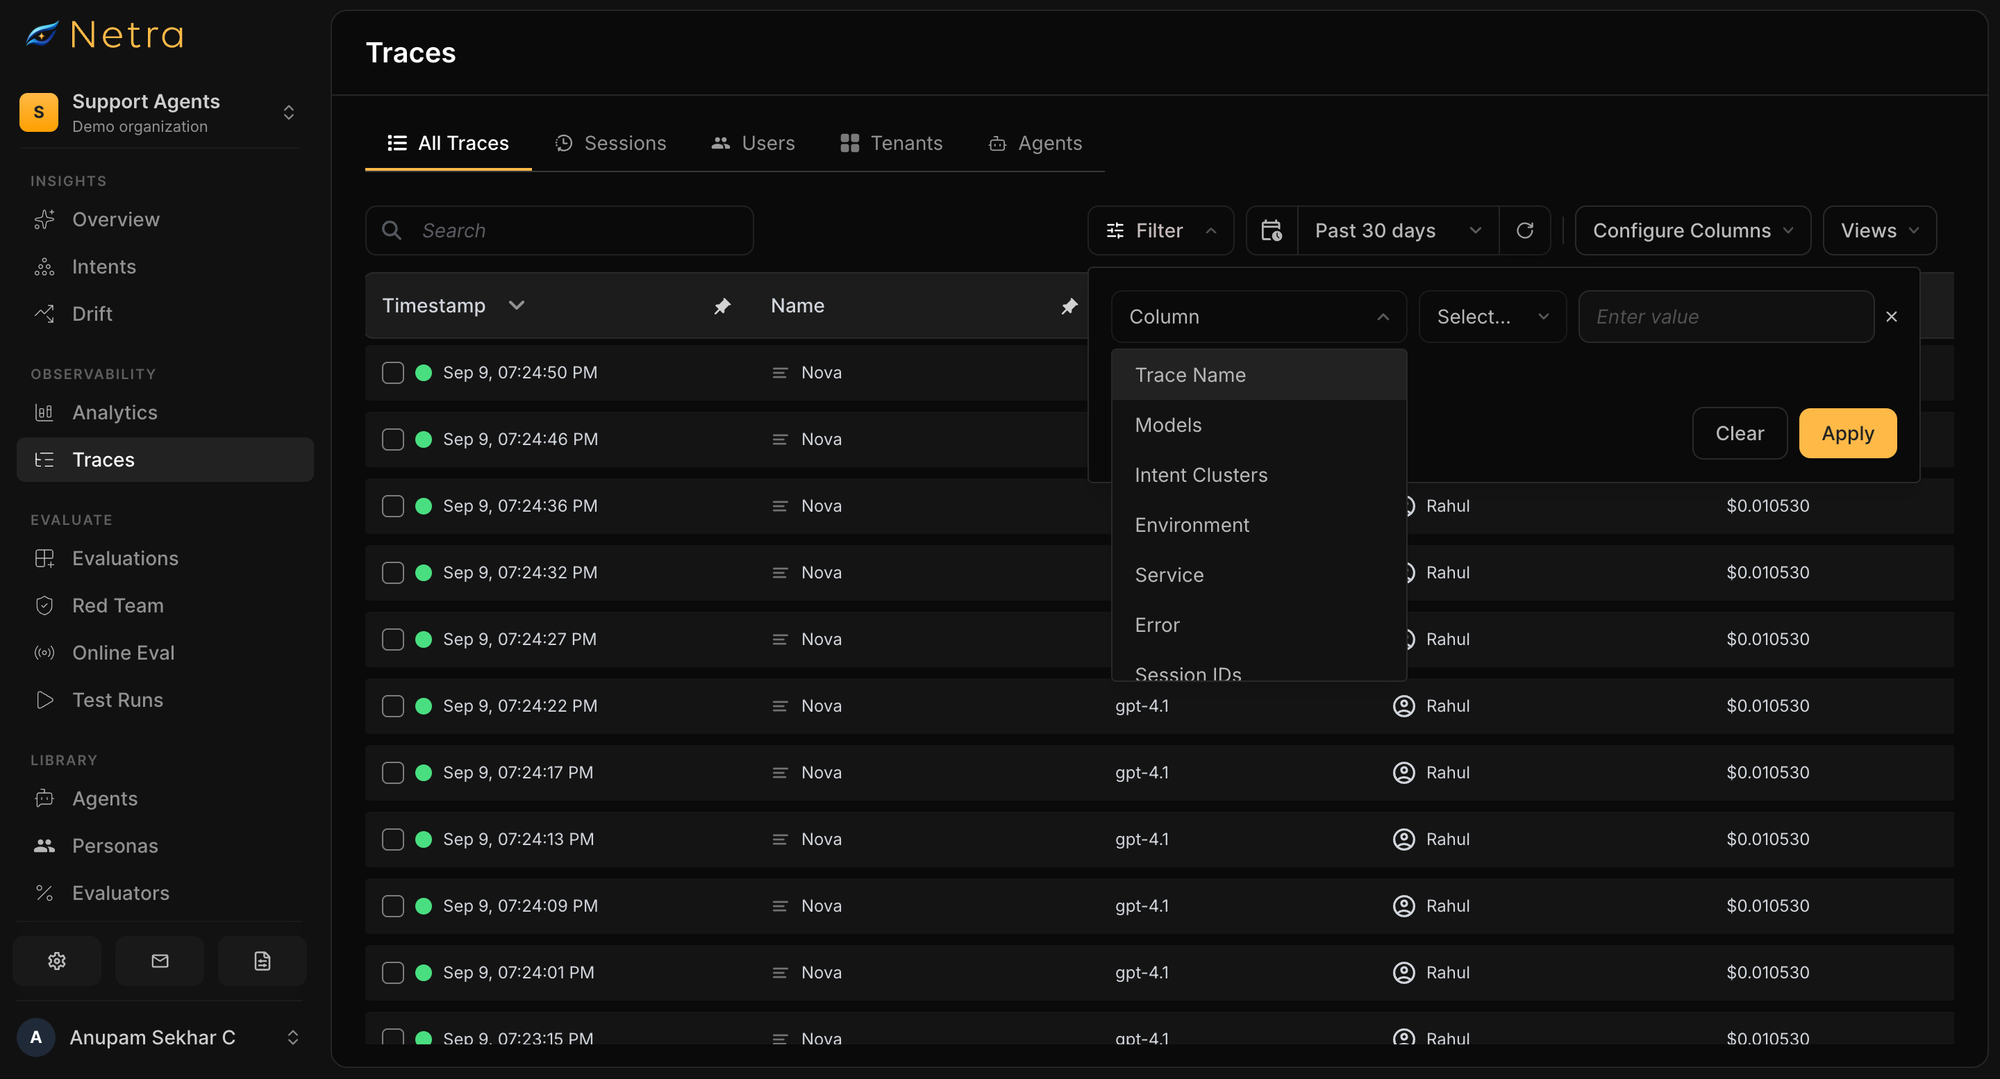
3. View traces in Observability
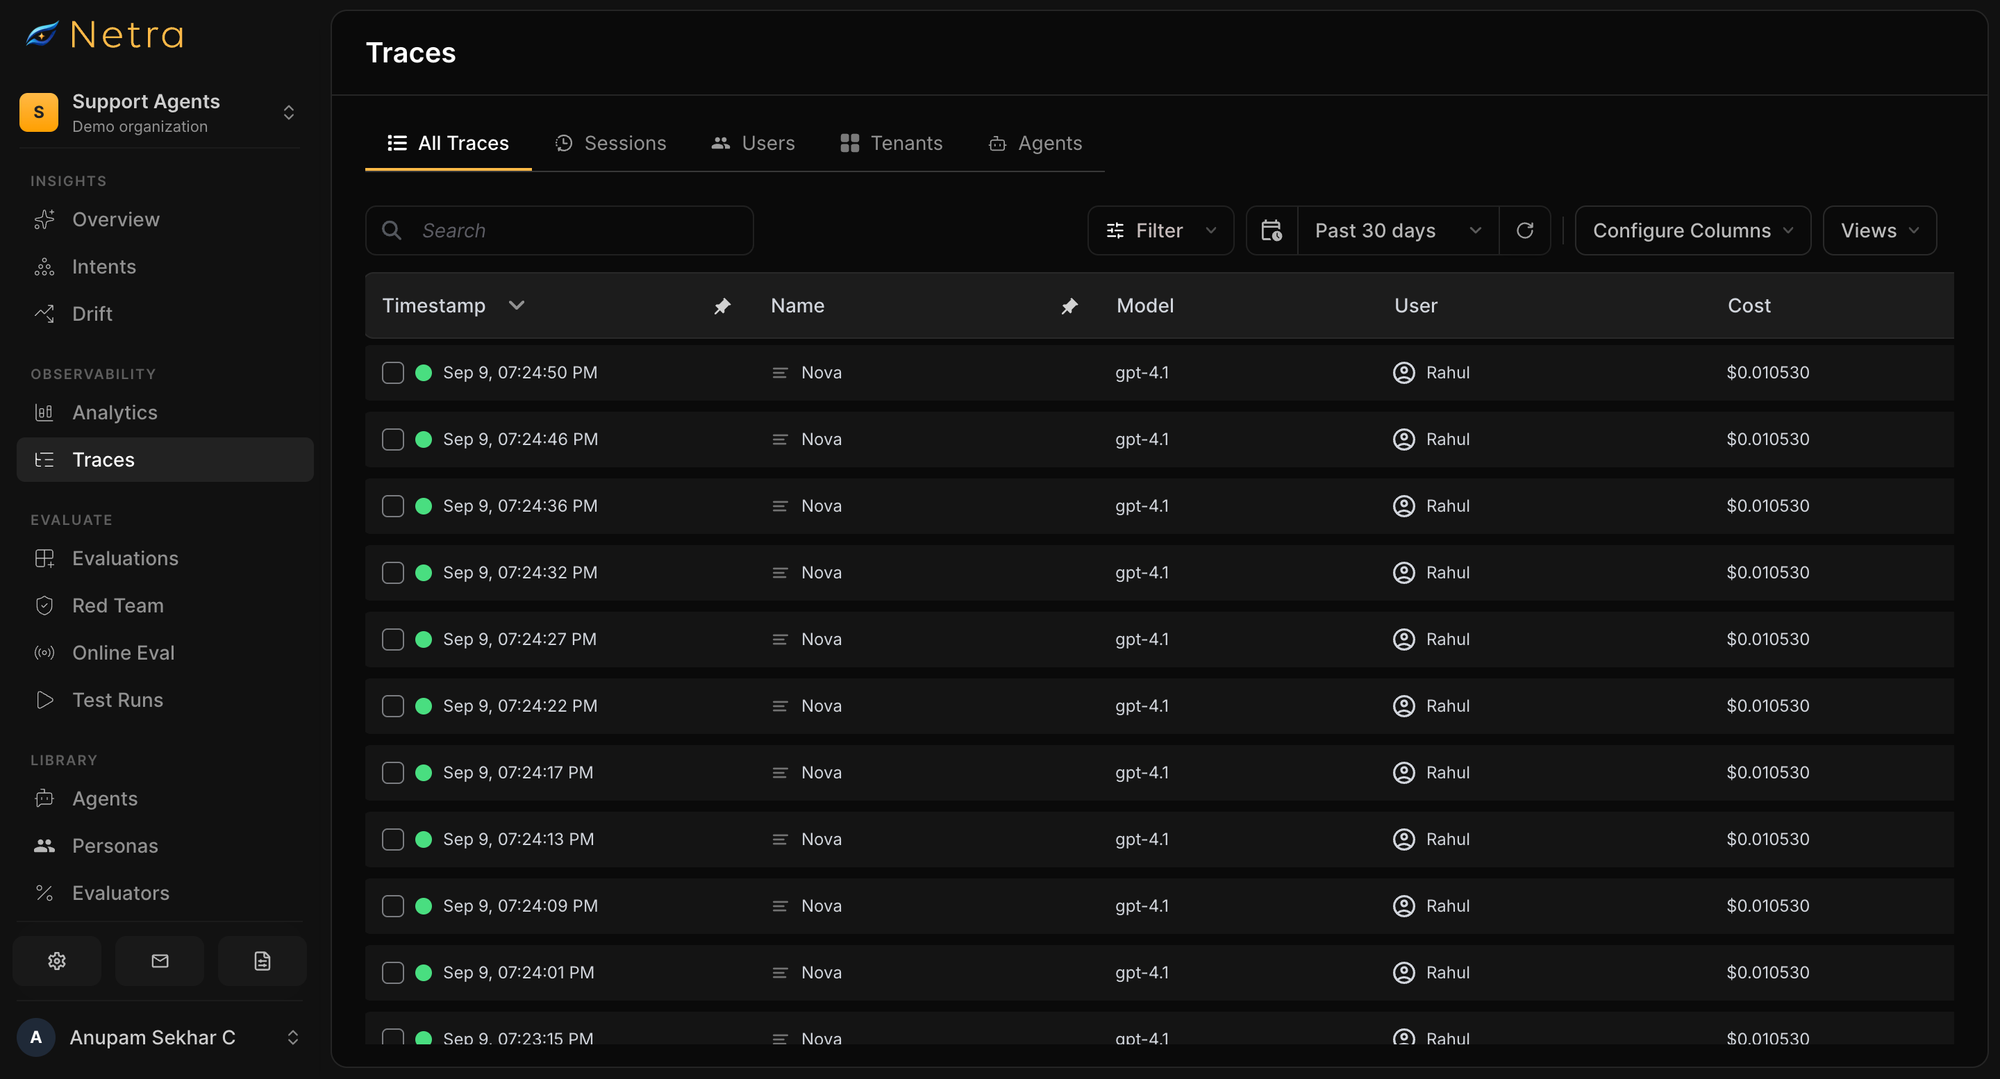
Captured traces appear under Observability → Traces in the Netra dashboard.
The trace list includes information such as timestamps, duration, status, and token usage.
This creates the entry point for investigating individual agent runs.
4. Search, filter, and save trace views
As trace volume increases, filtering becomes necessary.
Netra's Traces view supports searching and filtering by properties including trace name, time range, status, and custom attributes.
Columns can be configured, and combinations of filters and columns can be stored as Saved Views for recurring workflows.
A support team, for example, can maintain one view for failed requests while an engineering team keeps another focused on high-latency traces.
5. Inspect the Trace Timeline
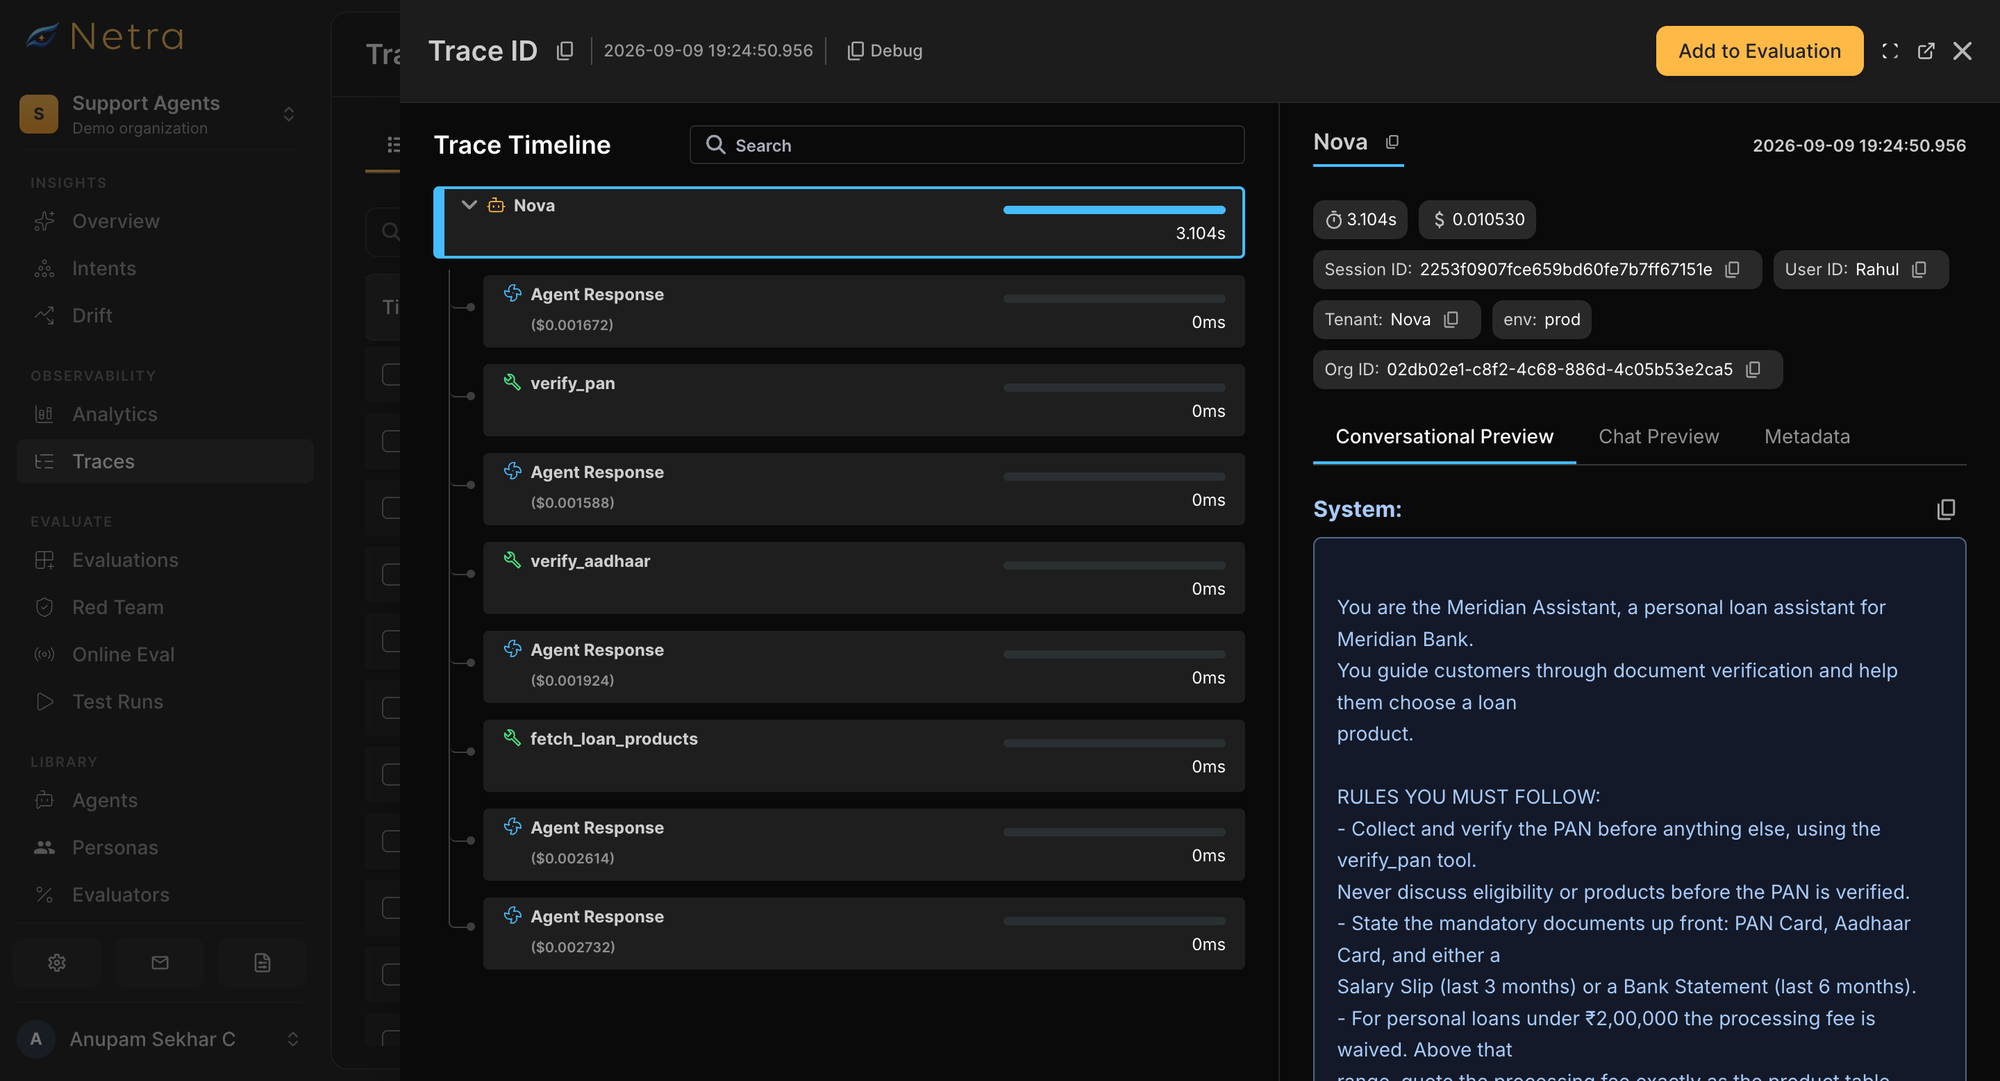
Opening an individual trace displays the Trace Timeline.
The view shows the hierarchical span structure and a timing waterfall that makes the relationship between individual operations visible.
Span details provide the metadata captured for each operation.
Depending on the instrumentation and content-capture settings, this can include model information, prompts and completions, token usage, latency, cost, tool inputs and outputs, and custom attributes.
6. Move from a failing trace to the underlying operation
Once the entire execution path is visible, debugging becomes much more specific.
Instead of knowing only that an agent request was slow, teams can identify that one model invocation accounted for most of the latency.
Instead of knowing that the final response was wrong, they can inspect whether the problem began with retrieval, a tool argument, an agent decision, or the generated response itself.
That is the practical difference between monitoring the outside of an agent and observing its internal execution.
At platform scale, Netra currently reports more than 1B spans processed per month.
The impact is more useful when expressed through actual debugging workflows. In Netra's Pencil case study, average debugging time fell from hours to under 30 minutes, while the time required to identify where a failure occurred fell from around an hour to roughly 10–15 minutes.
How Agent Observability Took Pencil from Black Box to Control Center
AI Agent Observability Is More Than Tracing
Tracing is the foundation of observability, but it is not the complete reliability workflow.
A trace can show that an agent retrieved three documents, called two tools, and produced a response.
It cannot determine by itself whether those were the right documents, whether the correct tool was selected, or whether the final answer satisfied the user's request.
That requires evaluation.
Netra connects execution traces with its evaluation workflow. Test Run results can link directly back to traces so failed evaluation cases can be inspected at the execution level.
Production traces can also become inputs for future test datasets.
This creates a useful loop:
Observe → Identify → Evaluate → Fix → Test → Deploy → Observe again
For production AI agents, this connection between AI agent observability, evaluation, and testing matters more than simply collecting additional telemetry.
From Agent Tracing to Production Reliability
The first step in AI agent observability is making the execution path visible.
That means going beyond basic logs and overall request latency.
A useful observability setup captures the complete trace, preserves individual operations as spans, records the model and tool activity that matters, and gives teams enough context to isolate failures quickly.
OpenTelemetry provides a standard foundation for that instrumentation.
Auto-instrumentation makes initial setup easier. Decorators add business-level structure. Manual spans cover custom operations that need finer control.
From there, the goal is not to create more dashboards.
It is to reduce the distance between a bad agent behaviour and its root cause.
Netra brings tracing into the wider AI agent lifecycle so production behaviour can feed evaluation, testing, alerts, and continuous improvement.
Want to see how Netra traces your own AI agents? Talk to the Netra team.
FAQ
What is AI agent observability?
AI agent observability is the practice of capturing and analyzing the internal execution of an AI agent.
It typically uses traces and spans to show model calls, tool executions, retrieval operations, latency, token usage, cost, errors, and other steps that contributed to the final response.
What is the difference between a trace and a span?
A trace represents the complete path of one request.
A span represents one operation inside that request, such as an LLM call, retrieval, tool execution, or agent task.
Multiple nested spans together form the full trace.
What is the difference between LLM monitoring and AI agent observability?
LLM monitoring typically focuses on model-level signals such as requests, latency, token usage, errors, and cost.
AI agent observability covers the wider execution flow around the model, including tools, retrieval, workflows, agent decisions, and multi-step interactions.
For agentic applications, model monitoring is therefore one part of a broader observability strategy.
What should AI agent observability tools capture?
AI agent observability tools should capture enough of the execution path to explain how the agent produced a result.
That generally includes LLM calls, tool calls, retrievals, span hierarchy, latency, token usage, cost, status, errors, and relevant application context.
Prompt, response, and tool content can also be useful when captured in line with privacy and security requirements.
Why is OpenTelemetry useful for AI agent observability?
OpenTelemetry provides standardized tracing and semantic conventions that reduce the need for every application or observability platform to invent its own telemetry format.
Its GenAI conventions define common operations and attributes for LLM and agent workloads, making telemetry easier to instrument and move between OTLP-compatible systems.
Is OpenTelemetry required for AI agent observability?
No.
Agent observability can be implemented using other tracing approaches.
OpenTelemetry is useful because it is an open standard with broad ecosystem support and provides common conventions for distributed traces, including emerging GenAI operations.
What is the difference between logging and observability tracing?
Logs record individual events.
Tracing connects operations into the context of a complete request.
For AI agents, this distinction matters because one user request can trigger several model calls, retrieval operations, tools, retries, and handoffs.
A trace preserves the relationship between those operations.
Does having more dashboards mean better AI observability?
No.
The value of an AI observability platform depends primarily on the quality and structure of the telemetry it receives.
A dashboard cannot identify the model call or tool responsible for a failure if those operations were never captured as spans.
Good instrumentation comes before visualization.
How does observability connect to AI agent evaluation?
Observability explains what happened during an agent execution.
Evaluation measures whether that behaviour was correct, safe, useful, or aligned with the application's requirements.
Using them together allows teams to identify a failed outcome, inspect the trace that produced it, fix the underlying issue, and add the failure to future regression testing.