Highlights
- Scaling agents for the AI-driven creative automation platform Pencil exposed the limits of traditional logging, making it difficult to trace failures across complex, multi-step execution flows.
- Netra, the agent observability, evaluation, and simulation platform, gave our team clear visibility into agent workflows, including tool calls, model invocations, latency, and failure points.
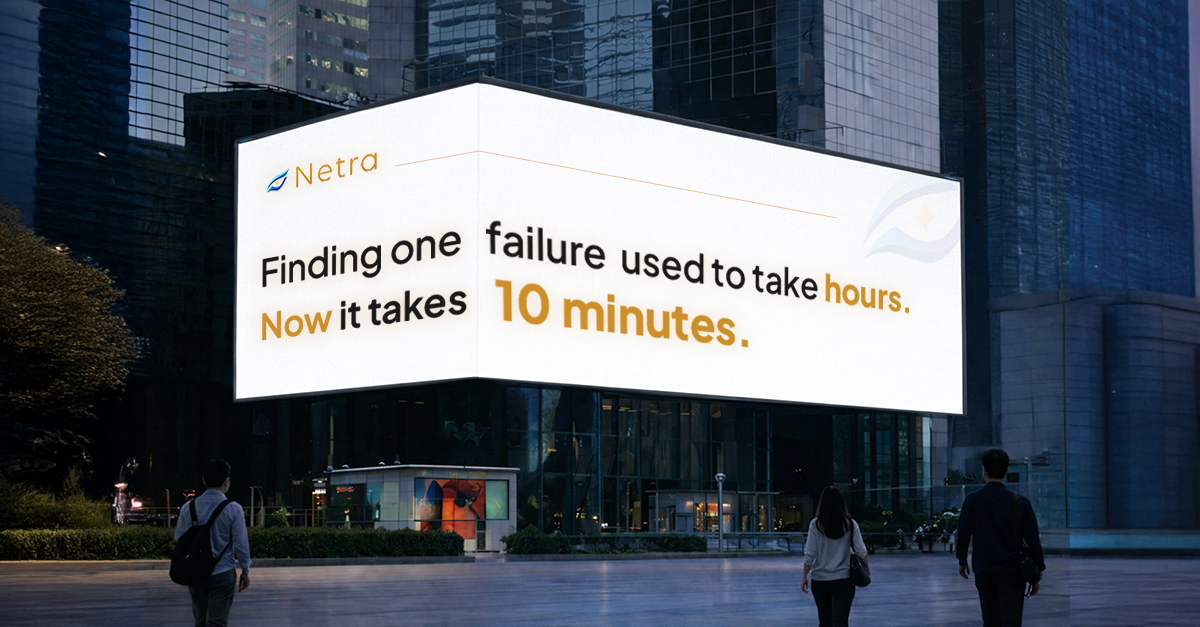
- With Netra, debugging and root-cause analysis became significantly faster, reducing investigation time from hours to under 30 minutes and failure identification time to 10–15 minutes.
- Agent observability platforms are becoming essential for modern agentic systems, helping teams move from black-box workflows to scalable, controllable, and production-ready operations.
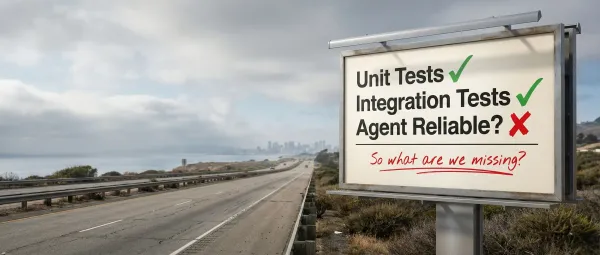
Building AI products is exciting right up until something breaks in production and nobody can tell you exactly where, why, or how often.
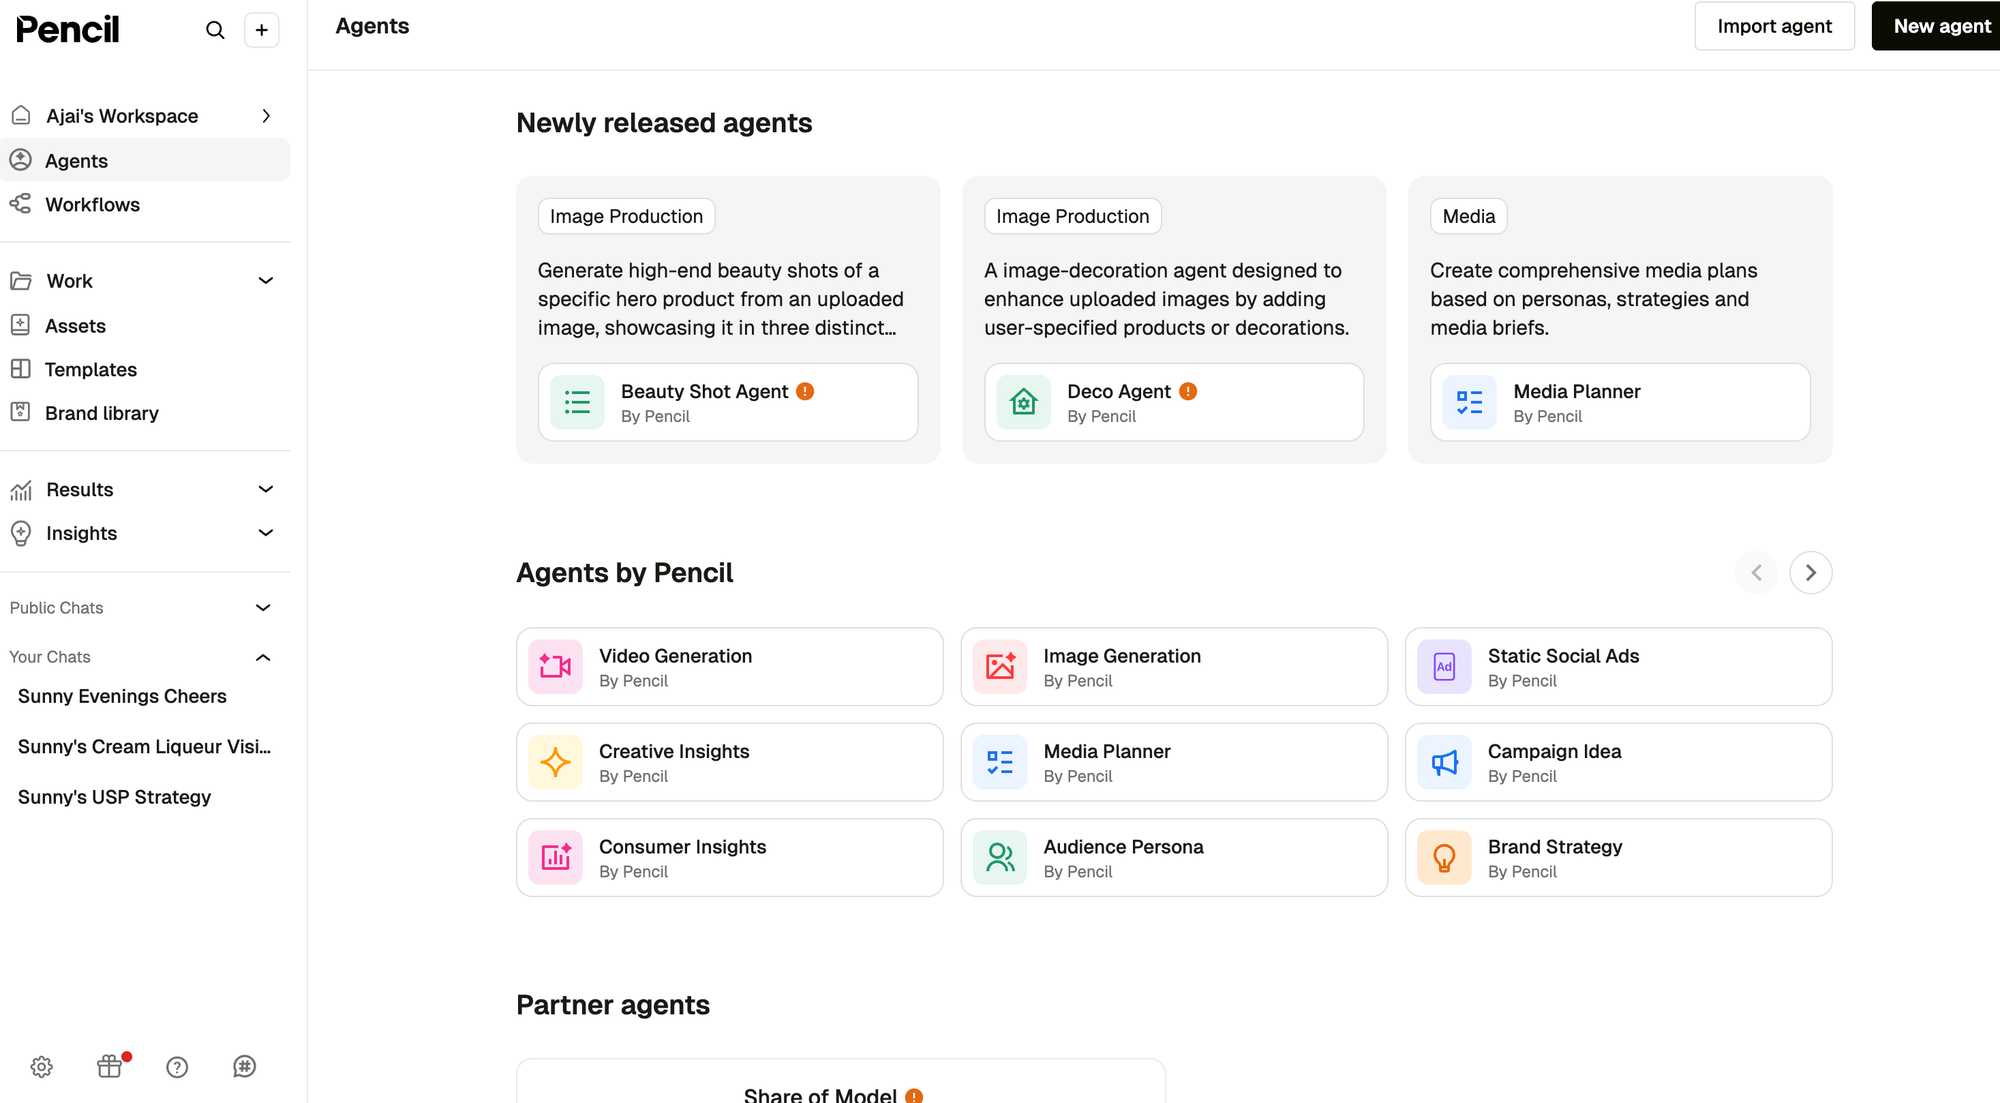
At Pencil, that problem started showing up more and more as our agent ecosystem grew. We are an AI-driven creative automation platform for enterprises and content teams, built to help marketers brainstorm, generate, scale, publish, and evaluate digital ads and marketing content faster. From image and video generation to creative insights and copy generation, agents sit at the center of how work gets done in Pencil.
That scale is exactly what made AI agent observability impossible to treat as an afterthought.
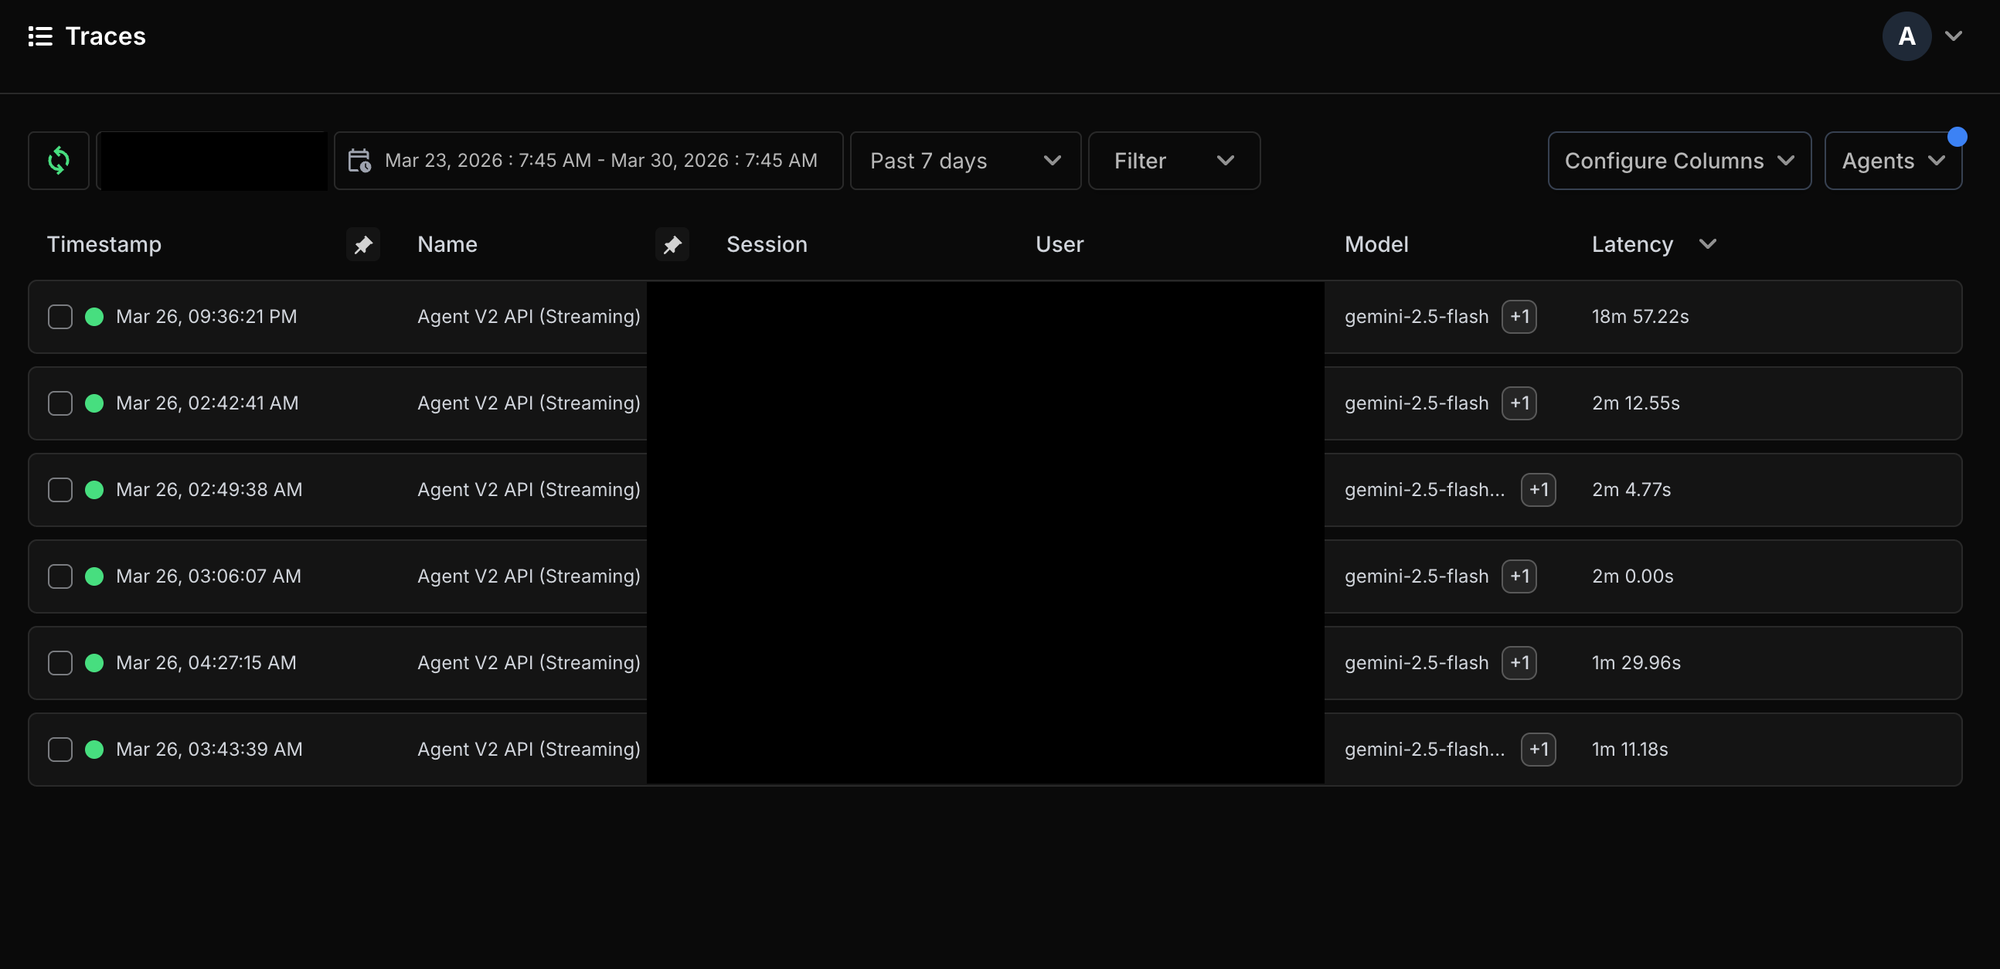
Today, Pencil supports more than 2,000 agents, handles roughly 28,000 generations a day, and produces over 37 million spans a month. At that level, debugging an issue is not just about finding an error message. It is about understanding what happened across an entire agent flow, often involving multiple steps, tools, and downstream services.
Before Netra, our agent observability, evaluation, and simulation platform, that process was far more manual than it needed to be.
The black-box problem
As our agent stack matured, one thing became increasingly clear: when an agent succeeded, everything felt smooth. When it failed, the path from symptom to root cause was rarely obvious.
A single agent interaction could involve orchestration logic, tool calls, model invocations, pre-execution checks, and streamed responses back to the UI. From the user’s perspective, it was one request. From the engineering side, it was a chain of dependent steps. Without clear tracing across that chain, the system could quickly start to feel like a black box.
That became especially painful in production.
Not every issue is a P0 incident. Many bugs get investigated later in the sprint, sometimes days after the original run. In a serverless environment, going back and reconstructing one problematic execution from raw logs is possible, but tedious. In our case, engineers often had to filter first by a broader work identifier, then narrow further by invocation-level identifiers, and then manually isolate the exact failed run from neighboring chats and executions around the same time.
With 28,000+ generations happening daily, that was often like looking for a needle in a haystack.
What we were doing before
Before Netra, our debugging workflow relied heavily on application logging.
We were manually logging latencies, writing out key execution details to our logger, and storing metadata alongside generation audit records to preserve some context around each run. That helped, but only up to a point.
Logs are still essential. They remain the source of truth when engineers need to confirm exactly what happened at the application level. But logs alone were not giving us an easy way to understand the full lifecycle of an agent execution. They told us pieces of the story, not the story itself.
And when something failed in a way that was technically subtle, the problem got worse.
Sometimes the issue was not a dramatic infrastructure failure or an obviously highlighted error. Sometimes it was a tool call buried inside a normal-looking stream of logs. Sometimes the user saw only a graceful fallback message in the UI while the real failure signal was hidden several layers deeper. Finding that manually took time, context switching, and a lot of guesswork.
Why we looked for better tracing
What we needed was not another dashboard for the sake of having a dashboard. We needed a way to follow an agent execution end to end, inspect each step, and immediately understand where time was being spent or where a failure entered the flow.
Netra fits well because it follows OpenTelemetry-style tracing principles and gives us a much more structured view of agent behavior than raw logs alone.
That mattered for two reasons.
First, we wanted to debug faster.
Second, we wanted to stop treating agent behavior as something engineers had to mentally reconstruct after the fact.
Integration was straightforward
The actual integration was simple.
From a code perspective, getting Netra wired in was quick. The heavier lift was not instrumentation itself, but the normal engineering process around testing, validation, and getting something production-ready. In practice, it was the kind of integration that could reasonably move through production in about a day within a standard QA and release process.
That was important for us. Agent observability improvements should not become their own large project.
What changed after integration
The biggest difference was not just that we had more data. It was that the data was finally navigable.
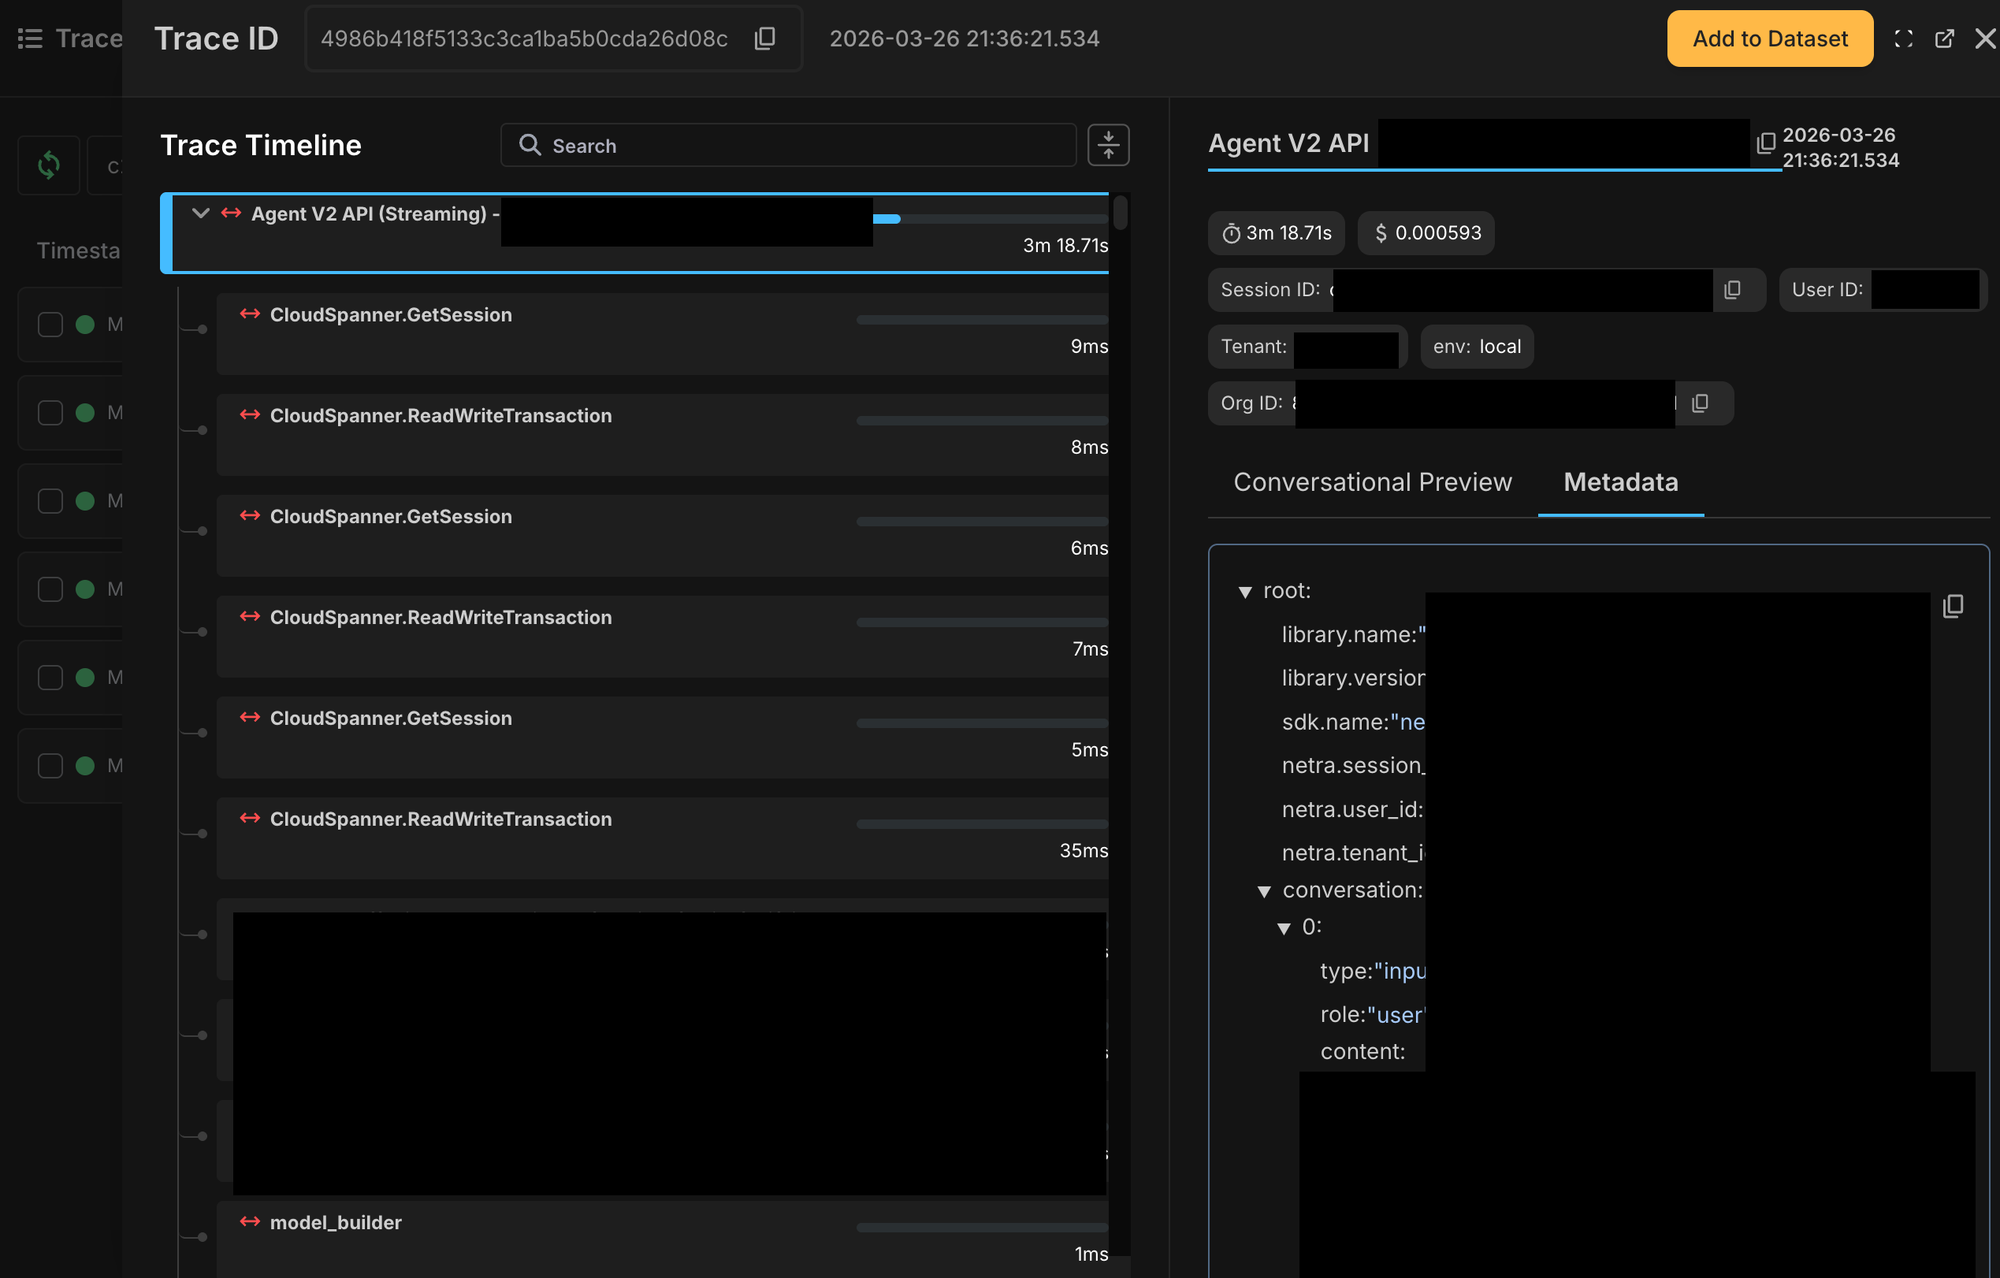
Instead of reading through chaotic log streams and trying to infer what happened, we could look at a single invocation trace and inspect the complete execution path. We could see which step ran when, how long it took, what inputs and outputs were involved, and where exactly the flow deviated.
That changed debugging in a very practical way.
Average debugging time dropped from hours to under 30 minutes. Time to identify where a failure happened dropped from around an hour to 10–15 minutes.
It also made latency analysis much easier. We could now see step-level timing across function and method invocations in the flow, which meant we no longer had to guess which part of the agent was slow. The UI made it clear what each step contained and how long it took.
For a platform with thousands of agents and tens of thousands of daily generations, that kind of visibility matters a lot.
A real example: when a user-facing failure was not enough
One incident made the value especially clear.
In an anonymized production scenario, a user tried to generate an image using a prompt along with style reference images. From the frontend, the experience looked simple: the assistant returned a polished message apologizing that it could not complete the request.
For the user, that was enough.
For engineers, it was not.
The real question was: what exactly failed inside the execution flow?
Without agent observability, this would have meant going back through server logs, filtering by the broader work context, narrowing into the relevant invocation, separating it from adjacent runs, and then manually piecing together which internal step had broken. That is doable, but it is slow, especially when the issue is being investigated days later.
With Netra, we could go directly to the relevant invocation, identify it using the timestamp and user prompt, and inspect the trace step by step.
That made the failure location obvious. The trace showed that the problem was not a generic “agent failed” scenario. It was a specific tool span: the image-generation tool call using a Gemini image-reference workflow had failed. The span clearly surfaced that the image result was null and that the model had returned an internal failure message.
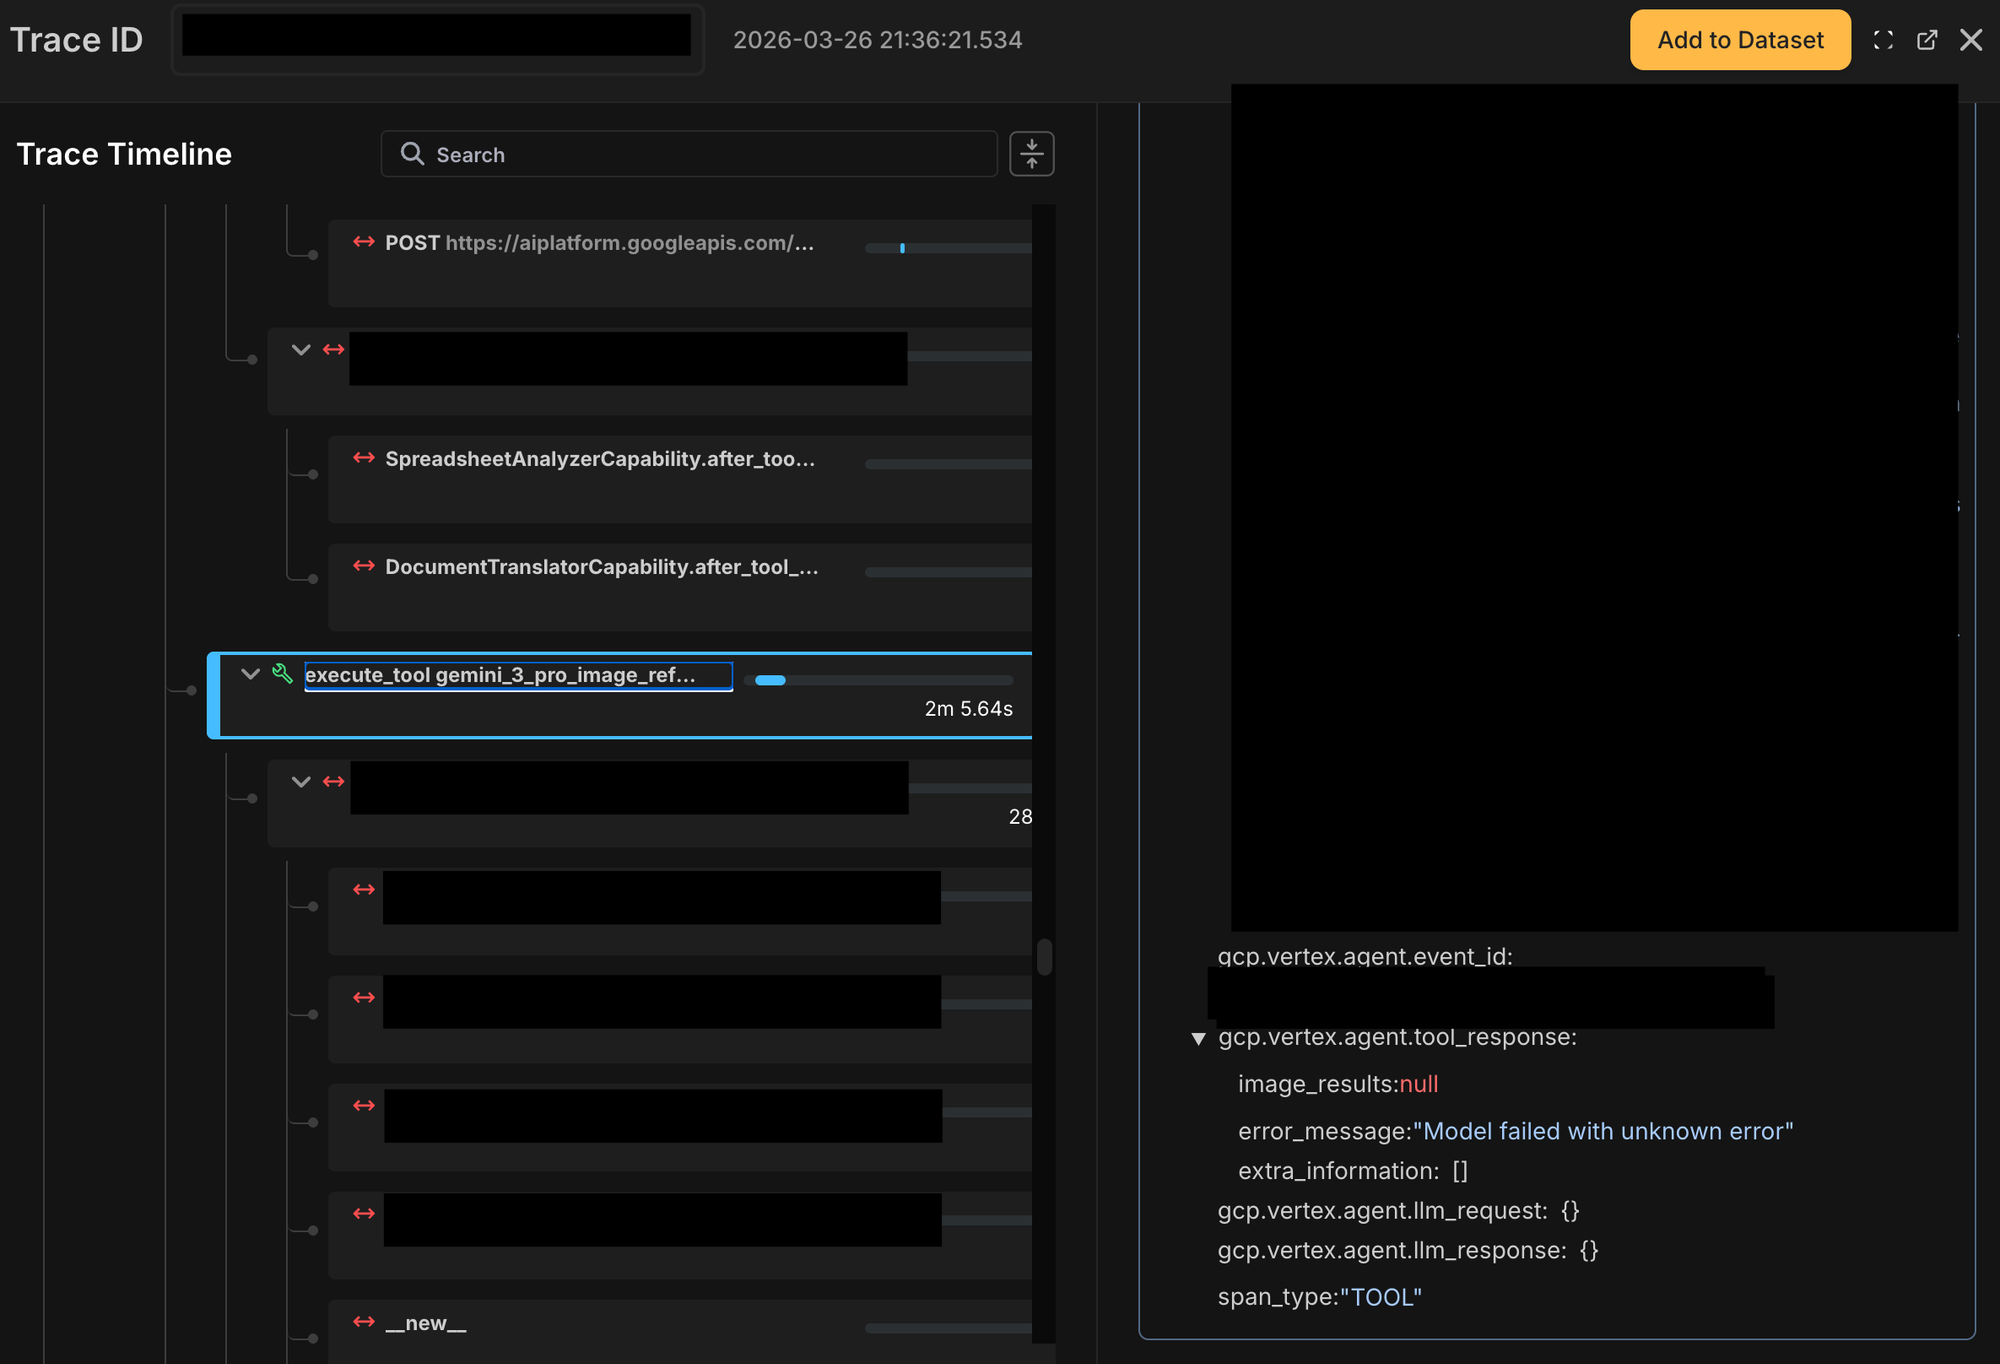
That alone narrowed the problem space dramatically.
Just as importantly, Netra made it easier to jump from the trace to the source-of-truth application logs and confirm the underlying provider-side failure. The logs were still necessary for final verification, but tracing removed the hardest part: figuring out where to look.
That is the key difference.
Raw logs are useful. But when you are debugging agent systems at scale, the hardest part is often not reading logs. It is finding the right logs, for the right execution, at the right step, without wasting hours reconstructing the path manually.
From manual correlation to operational clarity
That shift is what changed Netra for us from a nice-to-have into real infrastructure.
It gave us a practical control center for agent behavior.
Instead of treating failures as vague end-user outcomes, we could inspect them as structured execution paths. Instead of digging through logs first and hoping the right clue appeared, we could start with the trace, isolate the failing span, understand the timing and sequence, and then use application logs for confirmation.
For a modern agent platform, that workflow feels much closer to how debugging should work.
Why this matters for agent builders
As more products move toward agentic workflows, agent observability stops being optional surprisingly early.
The moment your system includes multiple tool calls, model invocations, asynchronous execution, or streamed responses, simple logging starts to break down as the primary debugging surface. You can still get the answer eventually, but the cost in engineering time rises fast.
We felt that firsthand.
At Pencil, agent observability helped us move from a world where agent failures felt opaque and time-consuming to investigate, to one where the execution path is visible, searchable, and much easier to reason about.
That has saved engineering time, reduced guesswork, improved latency visibility, and made debugging significantly faster.
Most importantly, it has made our agent stack feel less like a black box and more like something we can actually control.
FAQs
1. What is the black box problem in AI?
The black-box problem in AI is when a system produces an output or failure, but engineers cannot clearly see what happened inside the execution flow to cause it. In multi-step agent systems, this usually means the path from symptom to root cause is hard to trace across tools, models, and orchestration steps.
2. How does agent observability help debug multi-step agent workflows?
Agent observability helps by making the full execution path visible. It lets you inspect each step in a workflow, see where time was spent, identify where a failure entered the flow, and understand how the agent moved from one step to the next.
3. Can Netra pinpoint the exact failing step in an agent workflow?
Yes. Netra can surface the specific span or step where a workflow failed, making it easier to isolate the exact tool call or execution stage that caused the issue.
4. How is tracing different from raw application logs in agent systems?
Raw logs show pieces of what happened at the application level, but tracing shows the full execution path of an agent run. Tracing helps engineers find the right step and the right context first, while logs are then used to verify the underlying application-level details.
5. Does tracing replace application logs?
No. Application logs still remain the source of truth for confirming exactly what happened at the application level. Tracing complements logs by making it much easier to identify where engineers should look.
6. Is integrating Netra a large engineering effort?
No. The integration was straightforward from a code perspective and could move through production in about a day within a normal QA and release cycle. Most of the effort went into standard testing, validation, and production readiness rather than the integration itself.