
OpenTelemetry-native, framework-agnostic
Works with LangGraph, CrewAI, OpenAI Agents SDK, LlamaIndex, custom stacks
Improve
Featured cookbooks
Company
OBSERVABILITY
Drop in three lines of code and get a structured, replayable trace of every reasoning step, tool call, retrieval, and sub-agent handoff your agent makes in production.
Deep dive
When an agent fails in production, the first useful question is never "did the API return 200?" — it's "why did the agent pick that tool, with that input, at that step?" Standard APM doesn't answer that. It shows endpoints and response times. It doesn't show reasoning chains, prompt lineage, or the moment the agent went off-script.
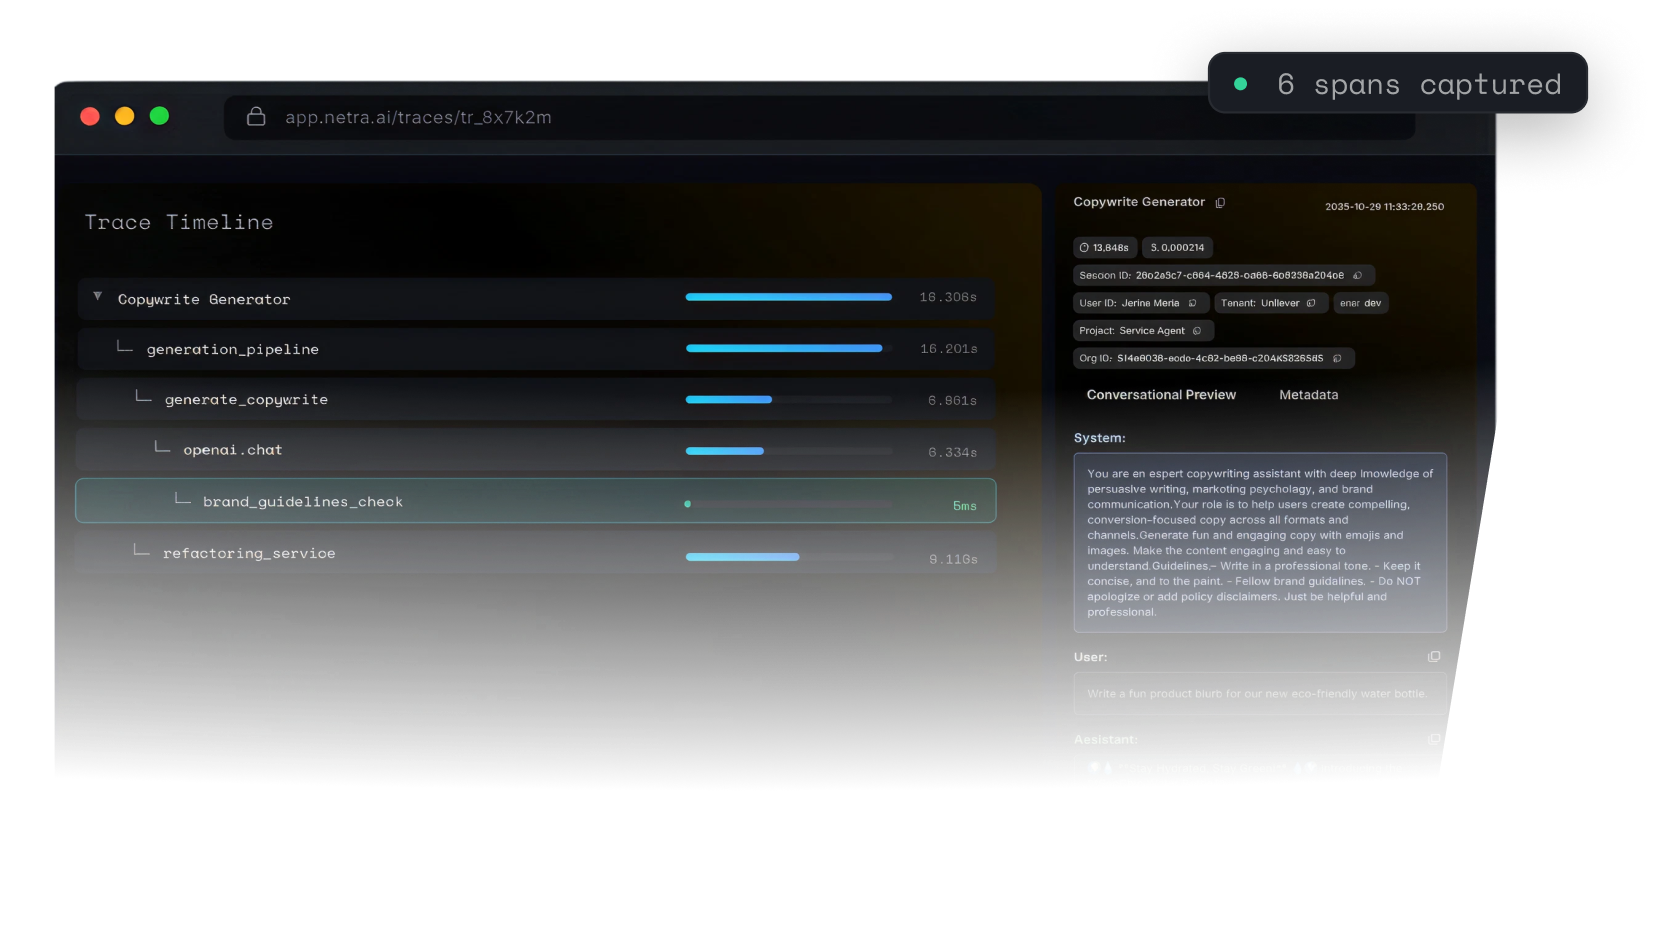
Netra captures the full decision graph of every agent run as a structured trace: model calls, tool invocations, retrieval hits, memory reads, sub-agent handoffs, and the exact prompts that drove each step. Sessions group multi-turn conversations end-to-end, so you see how context evolved across the entire user journey — not 47 disconnected log lines.
Instrument once with our OpenTelemetry-native SDK and you're done. Every span carries token usage, latency, cost, model version, and prompt version. When something regresses, you don't grep — you filter, replay, and find the exact span that broke. And because Netra speaks OTel, your existing observability stack keeps working: forward traces to Datadog, push metrics to Prometheus, archive to S3. No rip-and-replace.
Capabilities
Works with LangGraph, CrewAI, OpenAI Agents SDK, LlamaIndex, custom stacks
Multi-turn conversations grouped as a single trajectory, not fragmented logs
Prompts, tool args, retrieved chunks, token counts, latency, cost on every step
Bisect any regression to the exact change that caused it
Slack notifications and webhooks on latency, cost, quality, or error thresholds
Trace agent calls that span microservices, sub-agents, and external APIs
Filter by user, session, tool, model, status, cost, or any custom tag
Export to Datadog, New Relic, Prometheus, or S3 — Netra is a source of truth, not a silo
Get clear answers, fast — talk to our team and get tailored insights for your business in just a few minutes.
System prompt, user input, full output, span-level execution (each tool or LLM call as its own span), total time taken, dollar cost, session ID, and organization ID. Clicking into a span shows the arguments passed and the tool output or metadata.
A trace is the overall interaction; spans are the individual tool calls and steps within it — "verify identity" and "fetch financial profile" are two separate spans inside one trace.
Netra gives you a granular, span-by-span latency breakdown — each span records start and end timestamps and total duration, rendered on a visual timeline, so you can drill into exactly which tool call or LLM inference slowed the agent down.
Failed spans are flagged distinctly, carrying the error type, error message, and stack trace. Filtering by error state is built into the trace explorer.
Yes, traces can be exported in JSON or CSV format, either as a one-time export or on a scheduled basis. Tenant isolation ensures each tenant's export is clean, with no cross-contamination between customers' data.
Every trace captures session ID, user ID, and any custom metadata you attach at instrumentation time — all filterable in the dashboard. This lets you pull up every request from one user, or every trace in one session, and drill from session totals down to the exact span where things went wrong.
Trusted by teams shipping agents in production
Start today
Free to start. No credit card.