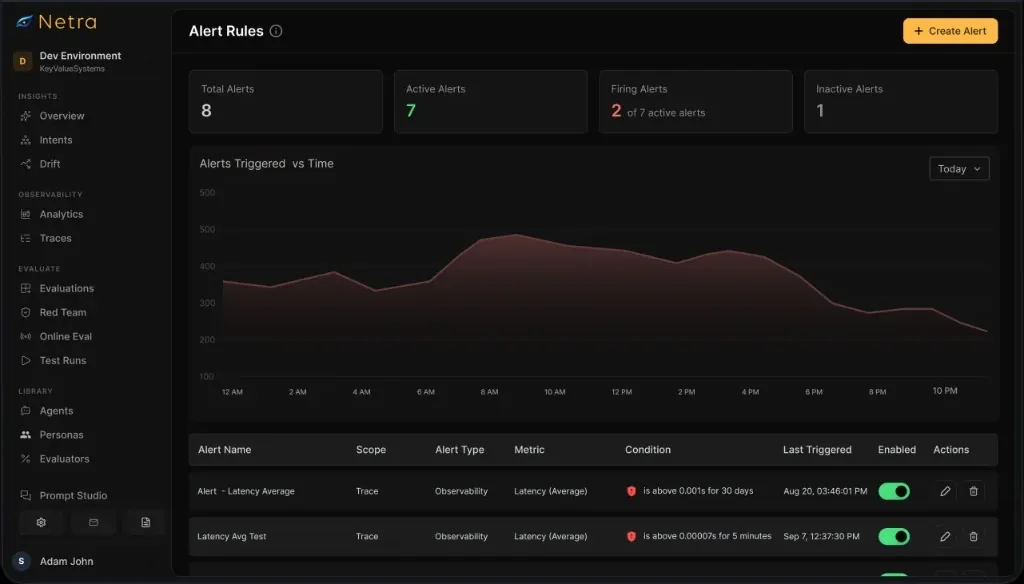
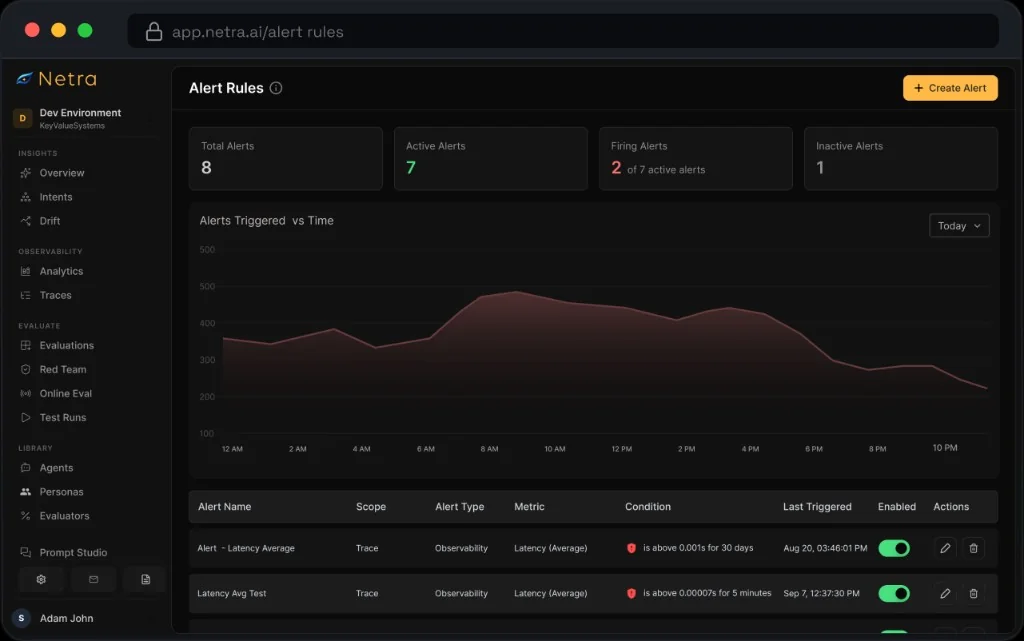
Alert on cost, latency, errors and tokens
Spend in USD, response time in milliseconds, error rate as a percentage, and input and output token counts.
Alert on cost, latency, errors and tokens: Docs (opens in new tab)Alerts
Trusted by teams shipping agents in production
What are Alerts?
Rules that tell you the moment something crosses a line. An alert rule watches a metric, either cost, latency, error rate or token count, at trace or span level, filtered to the model, tenant, environment or service you care about. When it is breached, Netra notifies your contact points within seconds.
Choose the metric, the threshold and the window, and decide how loudly it should shout. A drift gets a look; an outage gets a page.
Spend in USD, response time in milliseconds, error rate as a percentage, and input and output token counts.
Alert on cost, latency, errors and tokens: Docs (opens in new tab)Greater than, less than or equal to a value, with an optional window to evaluate over.
Set thresholds and time windows: Docs (opens in new tab)Decide which rules deserve a look and which deserve a page.
Grade alerts as warning or critical: Docs (opens in new tab)Alert on spend per request or per LLM call, filtered to the model or environment where it is happening.
Catch the runaway bill before month end: Docs (opens in new tab)Scope a rule to a single span, like one LLM call or one tool, instead of the whole request. Then narrow it to exactly the traffic it's about.
Watch whole requests end to end, or single operations such as one LLM call or one tool execution.
Set alerts at trace or span level: Docs (opens in new tab)Model, tenant, environment and service, so a rule fires for exactly the traffic it is about.
Combine multiple filters: Docs (opens in new tab)Filter a rule to one tenant ID and watch each customer's latency against the promise you made.
Hold every customer's SLA: Docs (opens in new tab)Filter by environment so a noisy test run never pages the on-call.
Keep staging out of production alerts: Docs (opens in new tab)Slack through a bot token or an incoming webhook, webhooks into your own tooling, and email to as many recipients as you need.
Create a team channel, an on-call inbox, and reuse them across every rule.
Set up multiple contact points: Docs (opens in new tab)Post to a channel or a person through a bot token, or use an incoming webhook URL.
Send alerts to Slack: Docs (opens in new tab)Call your own tooling with a webhook, and email as many recipients as you need.
Send webhooks and email: Docs (opens in new tab)Send a test notification after setup to confirm the rule reaches the right people.
Test before you trust it: Docs (opens in new tab)Rules evaluate as traces arrive, so the notification lands while the spike is still happening. Quality and drift alerts sit next to cost and latency ones.
There is no polling delay. A rule fires as soon as a trace crosses the line.
Know within seconds: Docs (opens in new tab)A falling pass rate, overall or per evaluator, can page you like any other metric.
Alert on quality with Online Evaluation: Docs (opens in new tab)Layer rules over insight metrics when a change in behaviour needs a human.
Alert on drift with Agent Insights: Docs (opens in new tab)Pause a rule during a planned change, edit a threshold, or delete it without touching the rest.
Enable, disable and edit rules: Docs (opens in new tab)Cookbook
Cookbook · Observability + Alerts
Set tenant context once, attribute every token to a customer, and put a tenant-filtered alert rule on each tier's latency target.
Open the cookbook (opens in new tab)What you'll build
Can't find the answer here? The Alerts docs go deeper, or talk to our team.
Cost, latency, error rate and token count. For quality, Online Evaluation alerts on pass rates, and alert rules can sit on top of Agent Insights metrics.
Rules evaluate in real time as traces arrive, with no polling delay — notifications arrive within seconds of the threshold being breached.
Email, to one or more recipients, and Slack — through the API with a bot token and channel, or through an incoming webhook URL.
Yes. Add a Tenant ID filter to a rule and it fires only for that customer — useful for SLA monitoring and budget enforcement.
Trace scope watches a whole request end to end. Span scope watches individual operations, such as a single LLM call or tool execution.
A few minutes: create a contact point, write a rule with a metric and threshold, and send a test. The alerts quick start walks through it.
Start today
Set your first alert rule in minutes and route it to the channel your team already watches. Free to start.