Highlights
- Debugging AI agents becomes slow when engineers have to move between IDEs, dashboards, logs, and trace data to understand what went wrong.
- Netra MCP brings that debugging context directly into the IDE, so engineers can investigate agent failures where they already work.
- With live access to traces, spans, tool calls, latency, cost, and decision paths, developers can quickly identify where an AI agent broke.
- Netra MCP connects IDE-based debugging with Netra’s broader AI observability, evaluation and simulation platform, helping teams move faster from investigation to resolution.
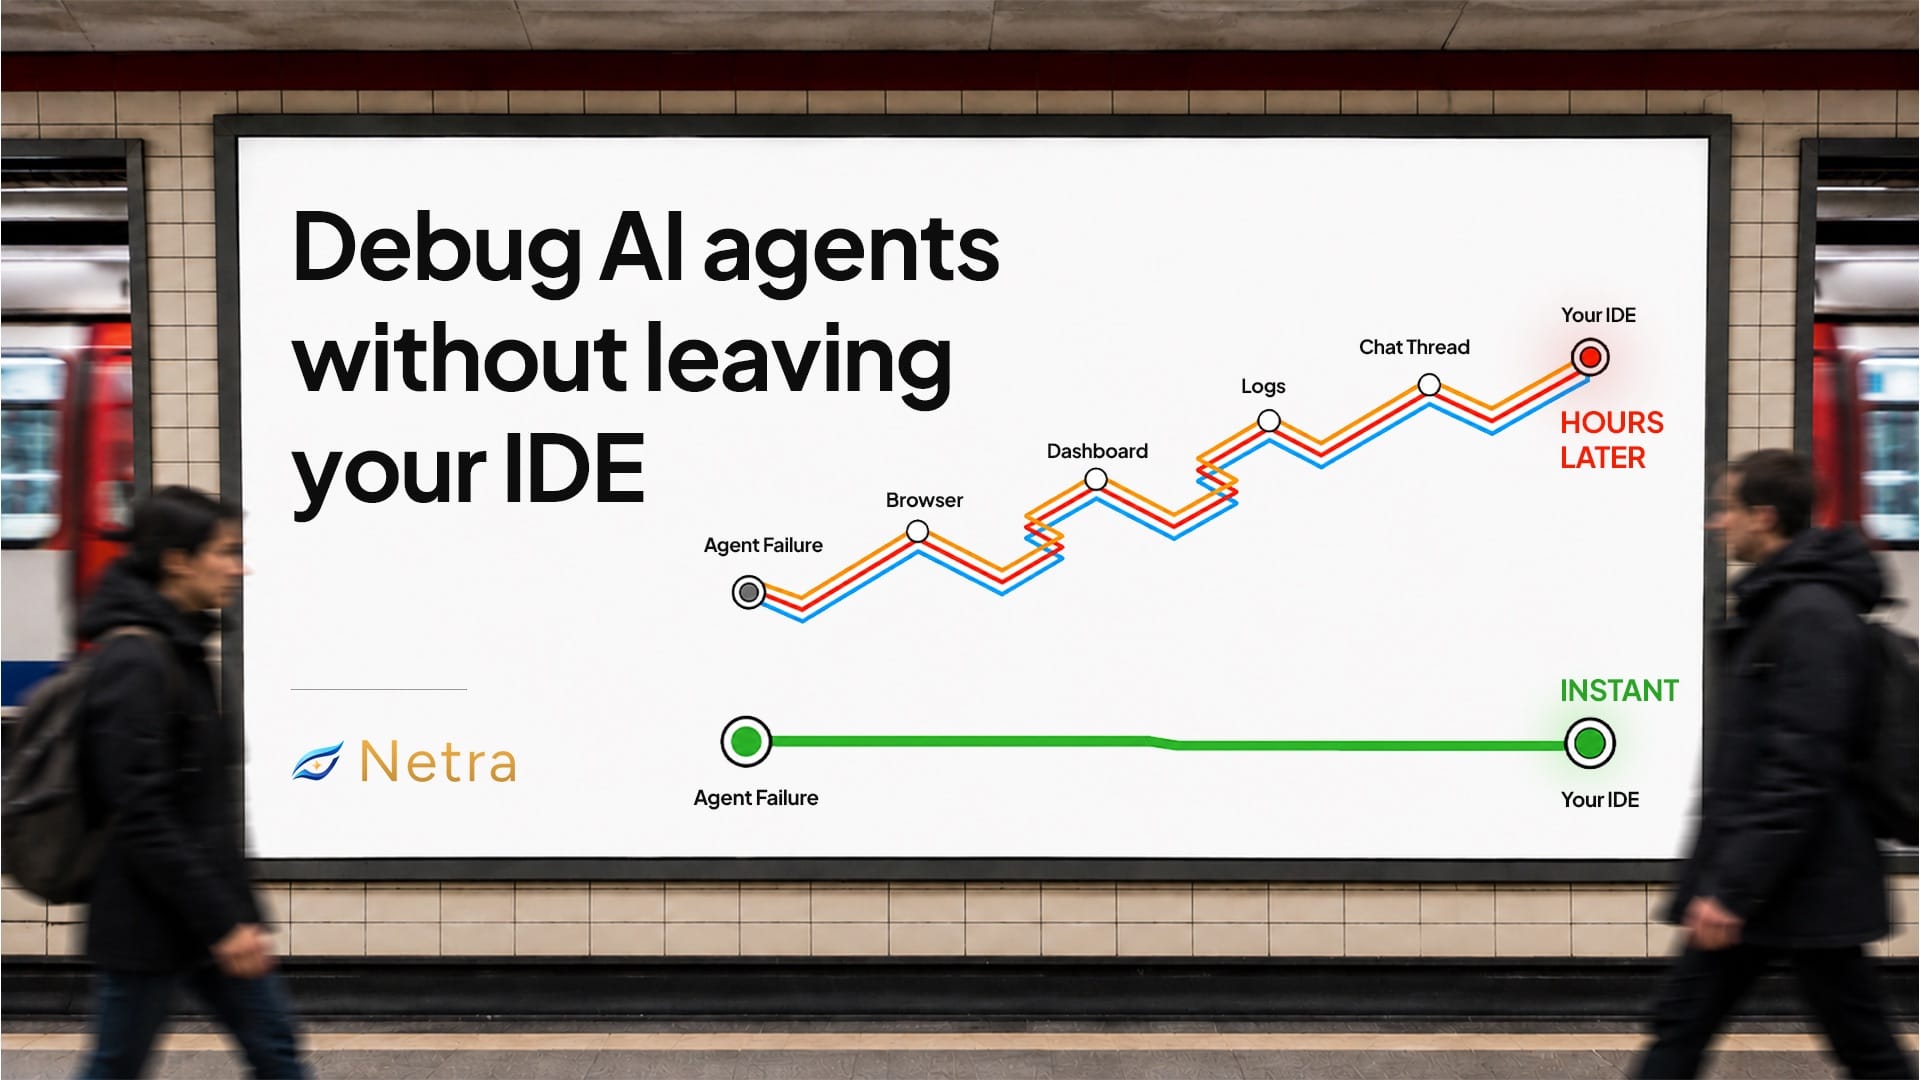
You're debugging a production issue. Your AI agent returned a wrong answer at 2 AM, a customer complained at 9, and now it's 11 and you're still context-switching between your IDE, your dashboard, your logs, and your chat thread trying to reconstruct what happened.
Every minute you spend leaving your IDE to hunt for trace data is a minute you're not fixing the problem.
That's exactly the workflow Netra MCP is built to eliminate.
What is MCP, and Why Does it Matter?
Model Context Protocol (MCP) is an open standard that lets AI coding assistants (Cursor, Claude Code, Windsurf, and others) connect to external tools and data sources. Instead of copy-pasting output between browser tabs and your IDE, an MCP-enabled assistant can query live data and reason over it inline, right where you're working.
For AI engineers, this is a significant shift. Your coding assistant stops being a glorified autocomplete and starts functioning as a real collaborator with access to the same context you have.
Netra's remote MCP server takes this a step further. But first, a quick word on what Netra is.
Netra is an AI observability, evaluation, and simulation platform built specifically for teams running AI agents in production. It gives you end-to-end trace visibility into every LLM call, tool execution, and decision path your agents make — plus evaluation, multi-turn simulation, prompt management, drift detection, and red teaming, all in one place. If your agent fails silently, hallucinates, or blows your cost budget, Netra is where you find out why.
Netra MCP is how that observability context comes to you, directly inside your IDE.
What is Netra MCP?
Netra MCP is a remote MCP server that exposes Netra's observability data to any MCP-compatible AI coding assistant. Once connected, your assistant can query traces and filter performance data without you ever leaving the IDE.
At its core, it surfaces two tools:
- netra_get_trace_by_id — Retrieve all spans for a specific trace ID. Every LLM call, tool invocation, latency measurement, and decision path in a single request.
- netra_query_traces — Query traces using filter conditions, exactly like using the filter field in the Netra dashboard, but from inside your IDE.
These two tools sound simple. In practice, they collapse the investigation loop that used to take hours down to a conversation.
Why Netra MCP: The Real Cost of Context Switching
Most AI engineers working in production know the debugging pain. But the bigger, often overlooked problem is context switching.
When your agent fails, here's what the typical workflow looks like without Netra MCP:
- User reports an issue (or an alert fires)
- Open the Netra dashboard in the browser
- Search for the relevant trace by time range or session ID
- Copy the trace ID
- Open a tab for the relevant span
- Switch back to the IDE to look at the code
- Form a hypothesis
- Go back to the dashboard to check another span
- Repeat
This isn't just slow; it's cognitively expensive. Each context switch breaks your working memory. And in production, every minute matters.
With Netra MCP, that loop collapses. You stay in your IDE and ask your assistant: "Show me the last 10 traces where latency exceeded 3 seconds" or "Get the full trace for trace ID xyz and tell me where the reasoning chain broke." The assistant queries Netra, pulls the data, and reasons over it inline.
Issues that once took 2 hours to debug now take 10 minutes. This is not a product claim; it's what Netra's customers consistently report.
How Netra MCP Works
Architecture
Netra's MCP server is hosted remotely. You don't run a local server or manage a sidecar. Your MCP client (Cursor, Claude Code, etc.) connects to the Netra endpoint using your API key and communicates over HTTP.
Region-specific endpoints:
- US: https://api.getnetra.ai/mcp
- EU: https://api.eu.getnetra.ai/mcp
Authentication uses an x-api-key header tied to your Netra project API key.
Netra MCP in action
Setting Up Netra MCP
Setup takes under two minutes. Pick your client and add the configuration.
Cursor — add to mcp.json:
"netra": {
  "url": "https://api.getnetra.ai/mcp",
  "headers": {
    "x-api-key": "<your-netra-api-key>"
  }
}
Claude Code — run from the command line:
claude mcp add netra --transport http https://api.getnetra.ai/mcp --header "x-api-key: <your-netra-api-key>"Alternatively, add it via JSON:
claude mcp add-json netra '{"type": "http", "url": "https://api.getnetra.ai/mcp", "headers": {"x-api-key": "<your-netra-api-key>"}}'To verify the server was added correctly:
claude mcp list
Windsurf — add to mcp_config.json:
"netra": {
  "url": "https://api.getnetra.ai/mcp",
  "headers": {
    "x-api-key": "<your-netra-api-key>"
  }
}
Codex — add to ~/.codex/config.toml:
[mcp_servers.netra]
enabled = true
url = "https://api.getnetra.ai/mcp"
[mcp_servers.netra.http_headers]
x-api-key = "<your-netra-api-key>"
Antigravity — add to mcp.json:
"netra": {
  "serverUrl": "https://api.getnetra.ai/mcp",
  "headers": {
    "x-api-key": "<your-netra-api-key>"
  }
}
After saving your config, restart the client. Verify the netra server appears in your available MCP tools list.
If you're running in the EU region, replace api.getnetra.ai with api.eu.getnetra.ai in all the above.
What You Can Do Once Connected
With Netra MCP live inside your IDE, your AI coding assistant gains the ability to:
- Retrieve full trace detail on demand - Ask for a specific trace by ID and get every span, tool call, latency number, and cost figure in context.
- Query traces with filters - Ask for traces matching specific conditions: error rate, latency thresholds, a particular user or session, a specific tenant.
- Debug agent failures inline - Instead of "I think the tool call failed here," your assistant can pull the actual trace and confirm where the reasoning chain broke.
- Correlate code changes to trace behavior - While reviewing a diff or a prompt change, your assistant can query whether traces in the affected time window look different.
Netra Skills: Turbocharging the MCP Workflow
Beyond the MCP server itself, Netra also ships Netra Skills — pre-packaged instrumentation patterns and best practices for AI coding assistants. Think of them as opinionated playbooks your agent follows when working with Netra.
Install with one command:
npx skills add KeyValueSoftwareSystems/netra-skillsThe CLI auto-detects which agentic interfaces you have installed and places the instructions in the right location. There are two available skills:
| Skill | What It Does |
|---|---|
netra-best-practices
|
End-to-end instrumentation, observability, and evaluation workflows for Python and TypeScript |
netra-mcp-usage
|
MCP-focused trace debugging — query and retrieval operations |
The netra-best-practices skill covers everything from SDK initialization and context tracking (user_id, session_id, tenant_id) to evaluation setup, simulation configuration, and advanced observability patterns. The netra-mcp-usage skill is purpose-built for the MCP debugging workflow described in this post.
To install individual skills:
npx skills add KeyValueSoftwareSystems/netra-skills --skill netra-best-practices
npx skills add KeyValueSoftwareSystems/netra-skills --skill netra-mcp-usage
Netra MCP and MCP Auto-Instrumentation: Two Different Things
One thing worth clarifying because it's a common point of confusion: Netra has two distinct MCP-related capabilities, and they serve completely different purposes.
Netra MCP Server is about querying your observability data from inside your IDE.
MCP Auto-Instrumentation (InstrumentSet.MCP) is something different — it's how Netra traces your own MCP-based agent calls as part of Netra's SDK instrumentation. If your application uses MCP for tool calls, Netra captures those calls automatically with no additional setup:
from netra import Netra, InstrumentSet
Netra.init(
    app_name="mcp-agent",
    instruments={InstrumentSet.MCP}
)
This gives you end-to-end span visibility on MCP tool calls in your own agent stack — exactly like Netra does for LangChain, CrewAI, PydanticAI, and the other 12+ frameworks it supports.
Both capabilities are useful. But they do different things: one traces your agents, the other helps you debug them from your IDE.
Where Netra MCP Fits in the Bigger Picture
Netra MCP doesn't exist in isolation. It's one layer in Netra's full AI observability, evaluation, and simulation platform — built by a team that shipped 25+ AI agents in production before building a tool to manage them.
The broader Netra platform covers:
- Observability : End-to-end tracing of every LLM call, tool execution, and decision path in real time
- Evaluation : Pre-release and online evaluation with LLM-as-judge and code evaluators, plus CI gates
- Simulation : Multi-turn conversational testing with configurable personas before real users hit the agent
- Prompt Management : Version-controlled prompt deployment without code redeployment
- Agent Insights : Automated intent discovery, drift detection, and daily plain-English briefings
- Red Teaming : Adversarial probing against OWASP LLM Top 10 and custom vulnerability suites
Netra MCP is the bridge between this rich observability context and the place where engineers actually spend their time: their IDE.
Getting Started
If you have a Netra account and traces flowing, adding the MCP integration takes less than two minutes:
- Grab your project API key from the Netra dashboard
- Add the netra entry to your MCP client config (Cursor, Claude Code, Windsurf, Codex, or Antigravity)
- Restart the client
- Verify the server shows up in your available tools
Then, the next time an agent fails in production, don't open a browser tab. Ask your assistant instead.
If you're not on Netra yet, you can get started on the free plan and have traces flowing in under five minutes with 2–3 lines of SDK code.
For the full MCP setup guide, visit docs.getnetra.ai/mcp/overview. For Netra Skills, head to docs.getnetra.ai/mcp/skills.
Less Context Switching, Faster AI Agent Debugging
Context switching is the silent productivity killer for AI engineering teams. Every time you leave your IDE to hunt for observability data, you're paying a cognitive tax that compounds across your entire investigation.
Netra MCP eliminates that tax. By exposing your LLM traces and agent behavior logs directly inside your coding assistant via the Model Context Protocol, it turns your IDE into a complete debugging environment — no browser tab required.
The best debugging sessions are the ones that end quickly. Netra MCP is built to make that the default.
FAQs
1. What is Netra MCP?
Netra MCP is a remote MCP server that brings Netra’s observability data into MCP-compatible AI coding assistants, so engineers can query traces and debug AI agents from inside the IDE.
2. Why do AI engineering teams need Netra MCP?
AI agent debugging often requires switching between code, dashboards, logs, and trace data. Netra MCP reduces that context switching by making trace investigation available directly where developers work.
3. What can developers do with Netra MCP inside the IDE?
Developers can retrieve full trace details, query traces with filters, inspect spans, review tool calls, check latency and cost, and identify where an agent’s reasoning chain broke.
4. Which MCP-compatible coding assistants support Netra MCP?
Netra MCP works with MCP-compatible clients such as Cursor, Claude Code, Windsurf, Codex, and Antigravity.
5. Is Netra MCP the same as MCP auto-instrumentation?
No. Netra MCP helps engineers query observability data from the IDE. MCP auto-instrumentation is different. It traces MCP-based tool calls inside your own agent stack through Netra’s SDK.
6. How long does it take to set up Netra MCP?
If you already have a Netra account and it is capturing agent traces, setup takes less than two minutes. Add the Netra MCP configuration to your MCP-compatible client, restart it, and verify that the server appears in your tools list.