Highlights
- AI agent alerts detect cost spikes, latency increases, errors, and excessive token usage without requiring teams to constantly check dashboards.
- Effective AI agent observability combines real-time alerts, execution tracing, response time monitoring, and production quality checks.
- Trace-level alerts monitor complete requests, while span-level alerts detect issues within individual model calls or tool executions.
- Netra supports configurable alert thresholds, traffic filters, and Slack or email notifications for faster incident detection.
- Combining alerts with AI agent drift detection helps teams catch immediate failures and gradual changes in agent behavior.
Your AI Agent's Costs Are Rising. Who's Watching?
A cost spike starts on Monday. Nobody is watching that particular dashboard, so nobody notices.
By Friday, four days of unnecessary AI spend have accumulated.
When an engineer finally investigates, the cause turns out to be a repeated tool call. The issue is fixed in minutes.
The expensive part wasn't the fix. It was the time between the problem starting and someone discovering it.
This is a common challenge in AI agent observability. Dashboards capture cost, latency, token usage, and execution data, but someone still needs to check them.
Real-time AI agent alerts close that gap by notifying engineering teams when production metrics cross predefined thresholds.
Instead of discovering problems through customer complaints or unexpected bills, teams can identify issues as they happen.
Here's how to configure meaningful alerts, monitor LLM costs in production, and use Netra for faster incident detection.
What Are AI Agent Alerts?
AI agent alerts are automated notifications triggered when production metrics cross configured thresholds.
For example, an engineering team might create an alert when an agent request costs more than $0.50, takes longer than three seconds, or experiences an error rate above 5%.
Unlike traditional application monitoring, AI agent observability must account for model calls, token consumption, tool executions, and multi-step workflows.
An agent might return a successful HTTP response while consuming excessive tokens. Another might complete its task but spend most of its execution time waiting for an external tool.
Alerts help teams detect these operational issues before they escalate.
Which AI agent metrics should you monitor?
These thresholds are illustrative. Actual limits should reflect normal agent behavior, traffic volume, and business requirements.
Why Dashboards Alone Aren't Enough for Incident Detection
Dashboards and alerts serve different purposes.
A dashboard helps engineers analyze performance trends, compare model costs, and investigate historical behavior.
An alert automatically notifies the team when a configured condition is met.
Consider an agent that normally responds within two seconds. After an integration update, a database lookup becomes significantly slower.
The dashboard records the slowdown, but unless someone checks it, the problem may remain unnoticed.
A latency alert can notify the team when the configured threshold is breached.
Trace-level vs. span-level alerts
A trace represents the complete execution of an agent request. A span represents an individual operation within that execution.
For example, a request might finish within three seconds while one database lookup takes 1.8 seconds.
The complete request may not breach its threshold, but a span-level alert configured for that lookup can still detect the slowdown.
How Does Response Time Monitoring Work for AI Agents?
Response time monitoring measures how long an agent takes to complete requests and individual operations.
For multi-step agents, latency can originate from model inference, retrieval, external APIs, or repeated tool calls.
Monitoring only average response time can hide problems affecting smaller groups of requests.
Teams should consider end-to-end latency, operation-level latency, and high-percentile response times, such as p95, when establishing service-level objectives.
Netra's observability platform provides execution traces to inspect model calls, tool activity, latency, and token usage.
This helps teams distinguish a slow agent from the specific operation causing the delay.
How to Monitor LLM Costs in Production
Monitoring LLM costs in production requires visibility into token consumption, model usage, and spending across agent executions.
A practical process involves four steps:
- Capture token usage and model costs across requests.
- Establish normal spending ranges for each agent or workflow.
- Configure cost alerts when spending crosses acceptable limits.
- Investigate expensive executions using traces.
For example, a support agent might normally cost a few cents per request. If one execution suddenly costs $0.50, the team needs to understand why.
The cause could be repeated model calls, an unexpectedly large context window, or unnecessary tool execution.
Netra helps teams attribute costs to traces and spans, making expensive operations easier to identify.
How to Set Up Real-Time AI Agent Alerts with Netra
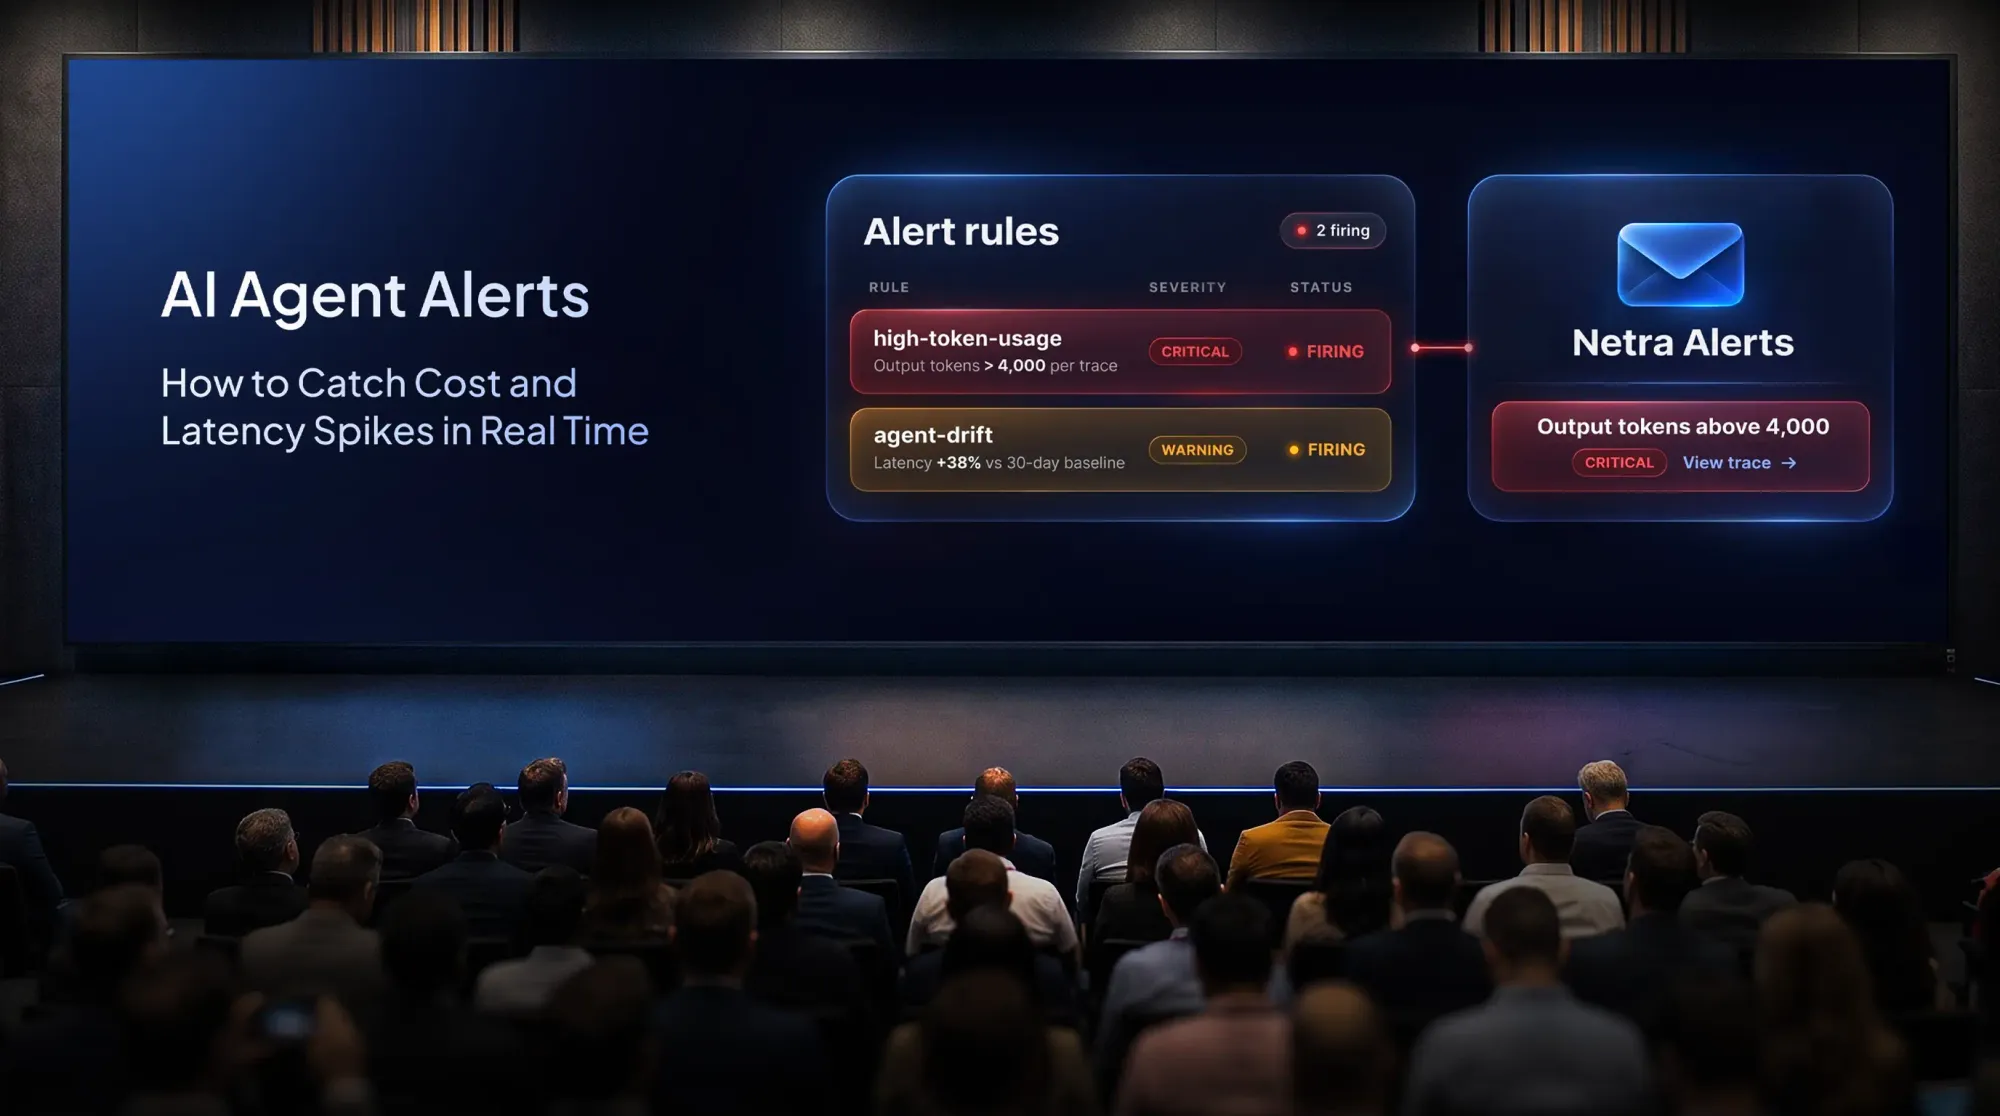
Netra's Alerts capability lets teams configure rules for production metrics and receive notifications when thresholds are breached.
Step 1: Create an alert rule
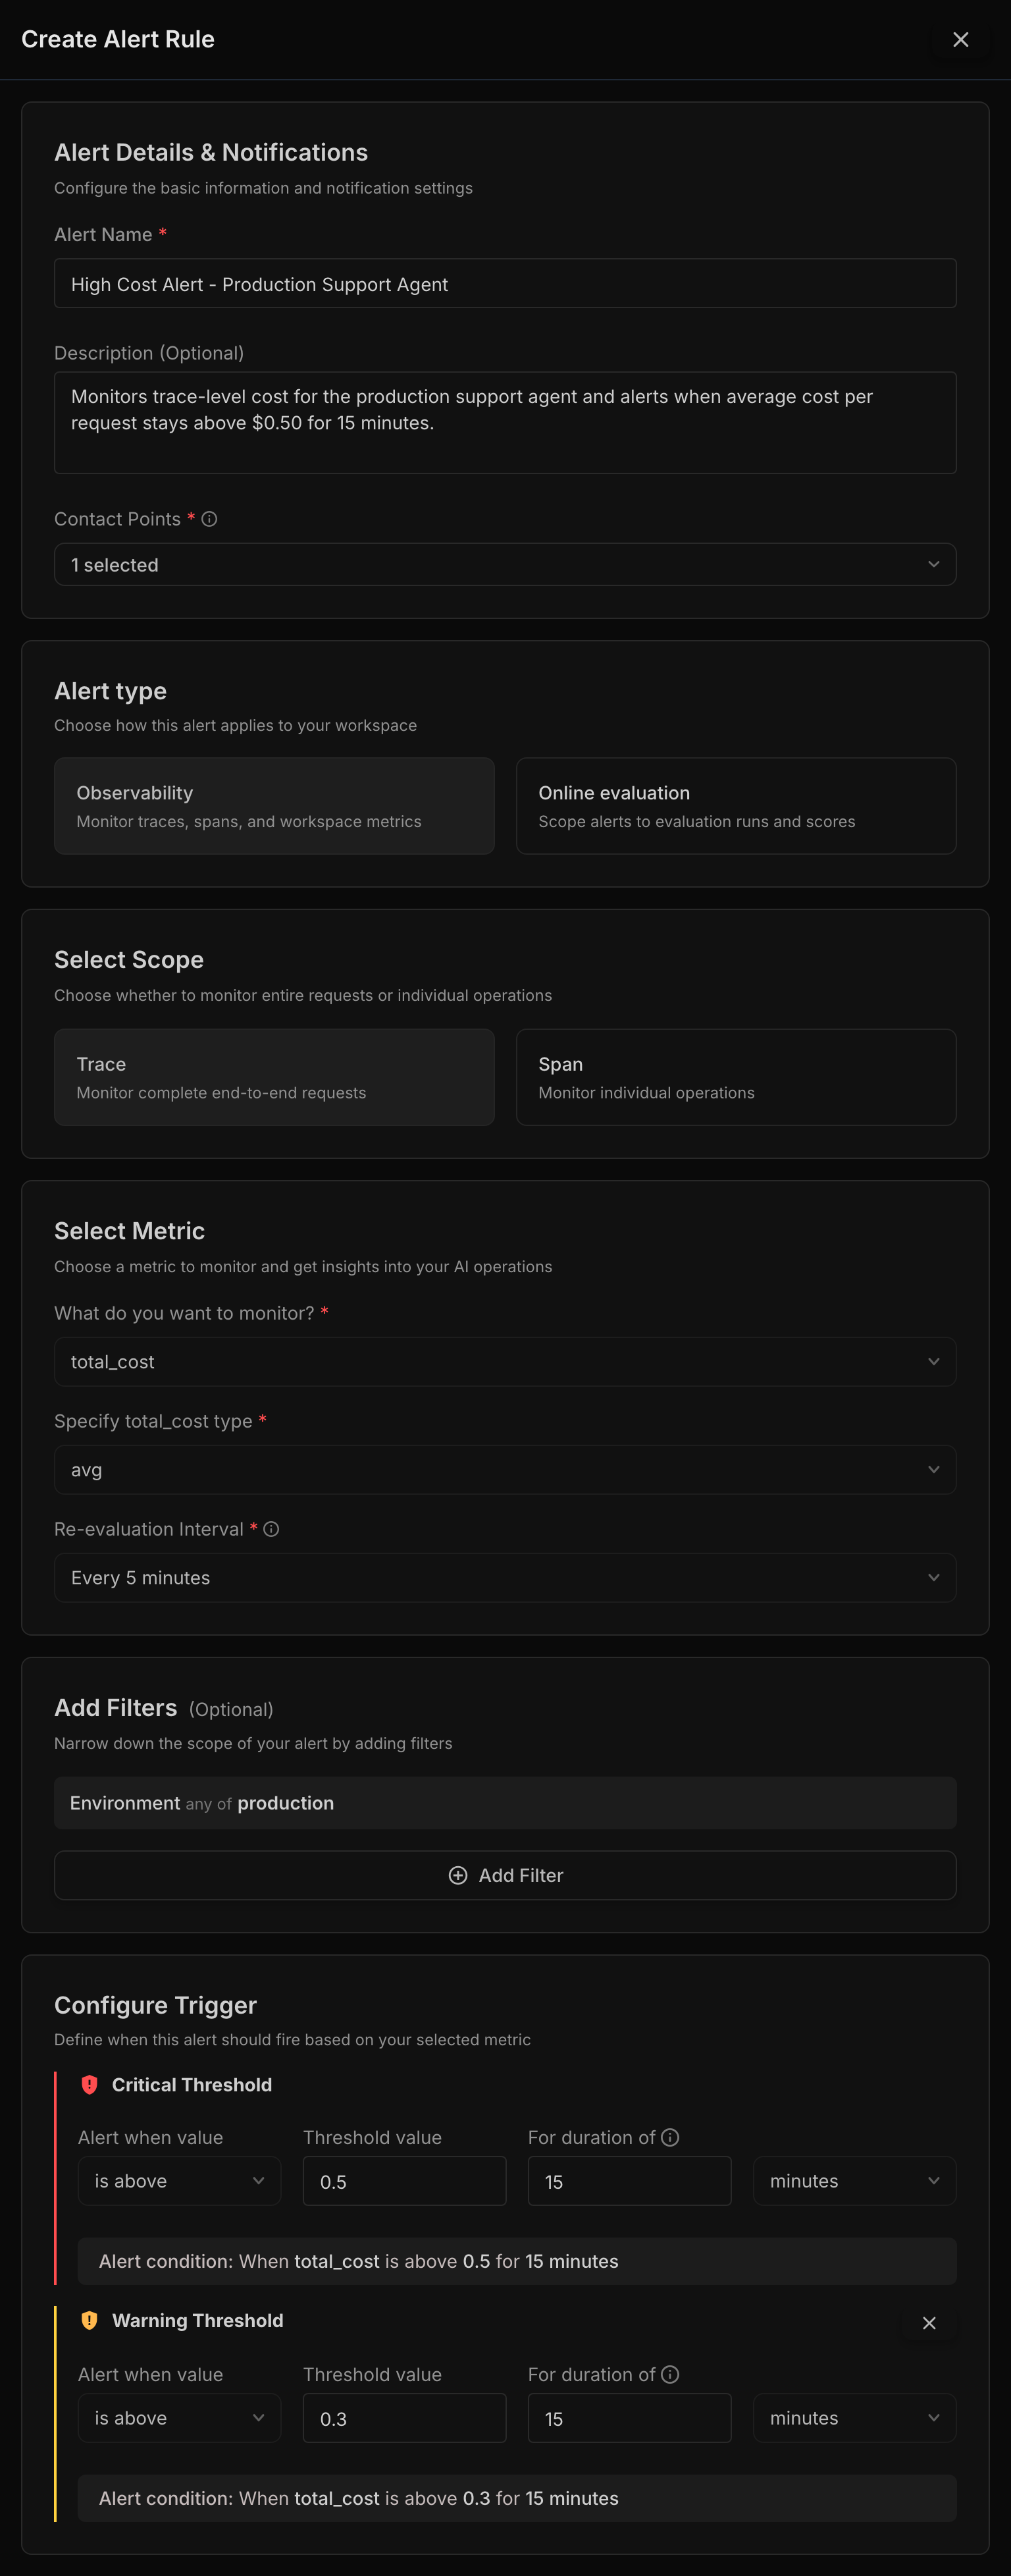
Open Alert Rules in Netra and select Create Alert Rule.
Give the rule a descriptive name, such as:
High Cost Alert - Production Support Agent
Add a description explaining what the rule monitors.
Step 2: Select the metric and scope
Choose the metric:
- Cost
- Latency
- Error Rate
- Token Count
Then select Trace for the entire request or Span for an individual operation.
For example, use trace-level cost monitoring for expensive conversations and span-level latency monitoring for slow tool calls.
Step 3: Configure alert thresholds
Set the condition, threshold, and evaluation window.
An illustrative configuration might look like this:
Use historical production data to establish meaningful limits. For aggregated metrics such as error rates, time windows help distinguish sustained problems from isolated failures.
Step 4: Filter production traffic
Netra supports filters for model, tenant ID, environment, and service.
For example, teams can monitor production separately from staging or configure customer-specific cost thresholds.
Filtering reduces unnecessary notifications from unrelated workloads.
Step 5: Configure notification channels
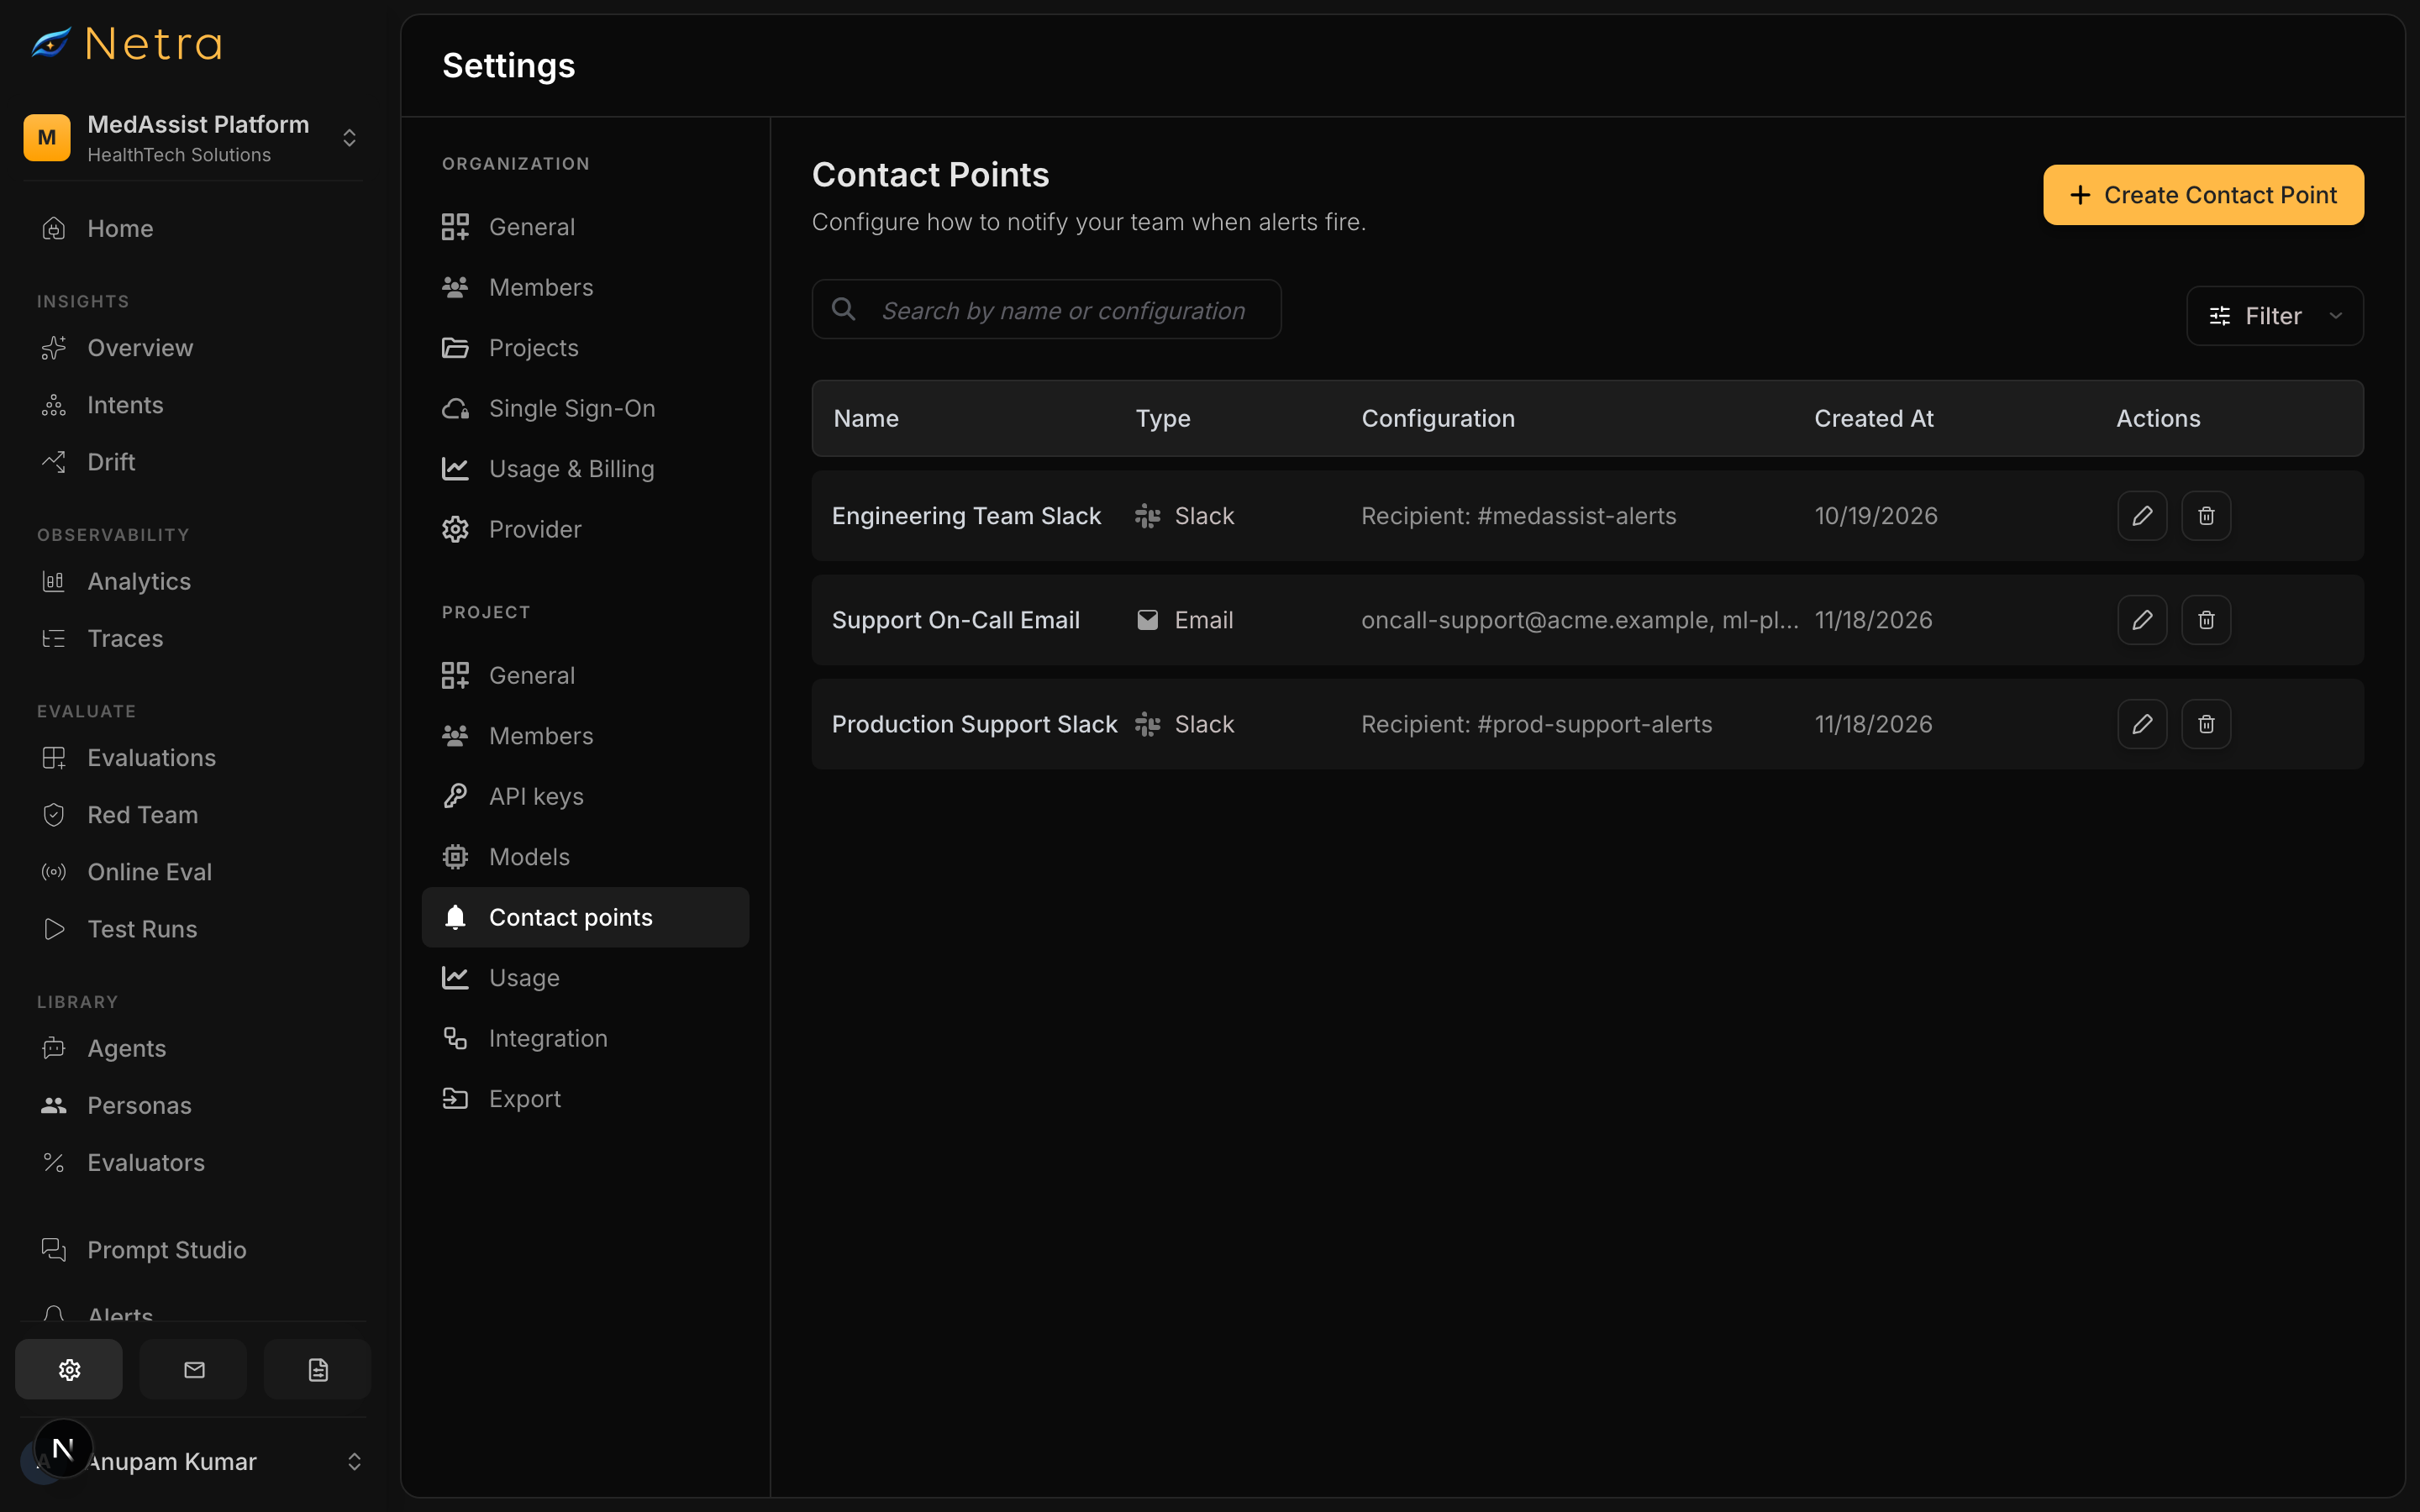
Navigate to Settings → Contact Points to configure email or Slack notifications.
Email supports multiple recipients. Slack can connect through a bot token and channel or an incoming webhook.
Assign the contact point to the alert rule and test notification delivery.
What Happens When an Alert Is Triggered?
Netra evaluates incoming traces against active alert rules.
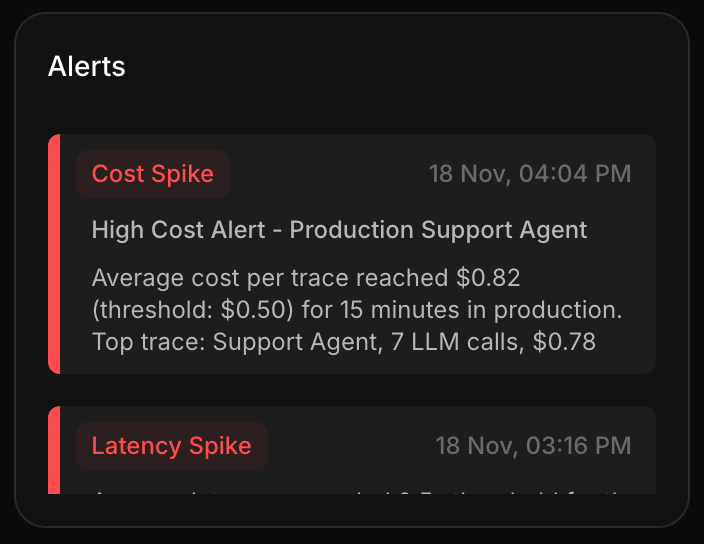
When a configured condition is met, Netra triggers a notification with relevant details and a link to the associated trace.
Suppose a support agent exceeds its cost threshold.
An engineer can open the trace and investigate repeated tool calls, excessive token consumption, or an expensive model invocation.
An alert tells you something crossed a limit. A trace helps explain why.
This connection between incident detection and execution tracing reduces the effort needed to understand what happened.
How to Set Alert Thresholds Without Creating Alert Fatigue
More alerts don't necessarily mean better monitoring.
When every minor fluctuation generates a notification, engineers may start ignoring alerts, including important ones.
Google's Site Reliability Engineering guidance recommends prioritizing actionable alerts and minimizing unnecessary noise.
Apply the same principle to AI agent monitoring.
Use production baselines to establish realistic thresholds. Configure appropriate time windows and distinguish warnings from critical incidents.
If a rule repeatedly triggers without requiring action, review its threshold, scope, and filters.
The goal isn't generating more notifications. It's ensuring important problems receive attention.
AI Agent Alerts vs. AI Agent Drift Detection
Threshold-based alerts detect known problems. AI agent drift detection identifies gradual changes in behavior that may not cross a predefined limit.
For example, an alert might trigger when latency exceeds three seconds.
But what if average latency gradually increases from 800 milliseconds to 1.5 seconds?
The agent is getting slower without breaching the configured threshold.
Netra's Agent Insights supports behavioral analysis, anomaly detection, and drift detection across production interactions.
Combined with Online Evaluation, teams can monitor response quality alongside operational metrics such as cost and latency.
Together, these capabilities provide broader visibility into AI agent reliability.
Catch Production Issues Before They Become Incidents
Dashboards explain what happened. Alerts help teams discover problems when they need attention.
For production AI agents, effective monitoring means tracking costs, response times, errors, and token usage while understanding the execution behind each issue.
Start with meaningful thresholds, monitor at the right scope, and route alerts to the people who can act.
Combine real-time alerts with execution tracing and AI agent drift detection to identify immediate incidents and gradual performance changes.
Netra brings these capabilities together within an AI agent observability platform, helping teams move from incident detection to investigation without reconstructing behavior from disconnected logs.
Explore Netra's Alerts or talk to the Netra team to configure real-time monitoring for your agents.
FAQs
What are AI agent alerts?
AI agent alerts are automated notifications triggered when production metrics such as cost, latency, error rate, or token usage cross configured thresholds. They help engineering teams detect operational issues without constantly checking monitoring dashboards.
How do you monitor LLM costs in production?
Track model calls, token consumption, and spending across agent executions. Establish normal cost ranges, configure spending thresholds, and investigate expensive requests using traces. Netra supports cost monitoring at trace and span levels, with filters for models, environments, and tenants.
What is response time monitoring for AI agents?
Response time monitoring measures how long an AI agent takes to process requests and execute individual operations. It helps teams detect slow model calls, retrieval steps, and external tools. Trace-level monitoring shows end-to-end latency, while span-level monitoring identifies specific bottlenecks.
What is the difference between AI agent alerts and drift detection?
Alerts detect when predefined thresholds are crossed. Drift detection identifies changes in agent behavior compared with historical baselines. Both are useful: alerts identify known operational problems, while drift detection helps uncover emerging issues that might not exceed fixed limits.
How do you avoid alert fatigue in AI agent monitoring?
Use production baselines to set meaningful thresholds, apply filters to relevant traffic, and configure suitable time windows. Distinguish warning and critical conditions, and regularly review alerts that repeatedly trigger without requiring action.
Can Netra send real-time AI agent alerts to Slack?
Yes. Netra supports Slack notifications through a bot token and channel or an incoming webhook. Email notifications can also be configured for multiple recipients. Teams can reuse contact points across alert rules and send test notifications to verify delivery.